01
Compare sessions at a glance
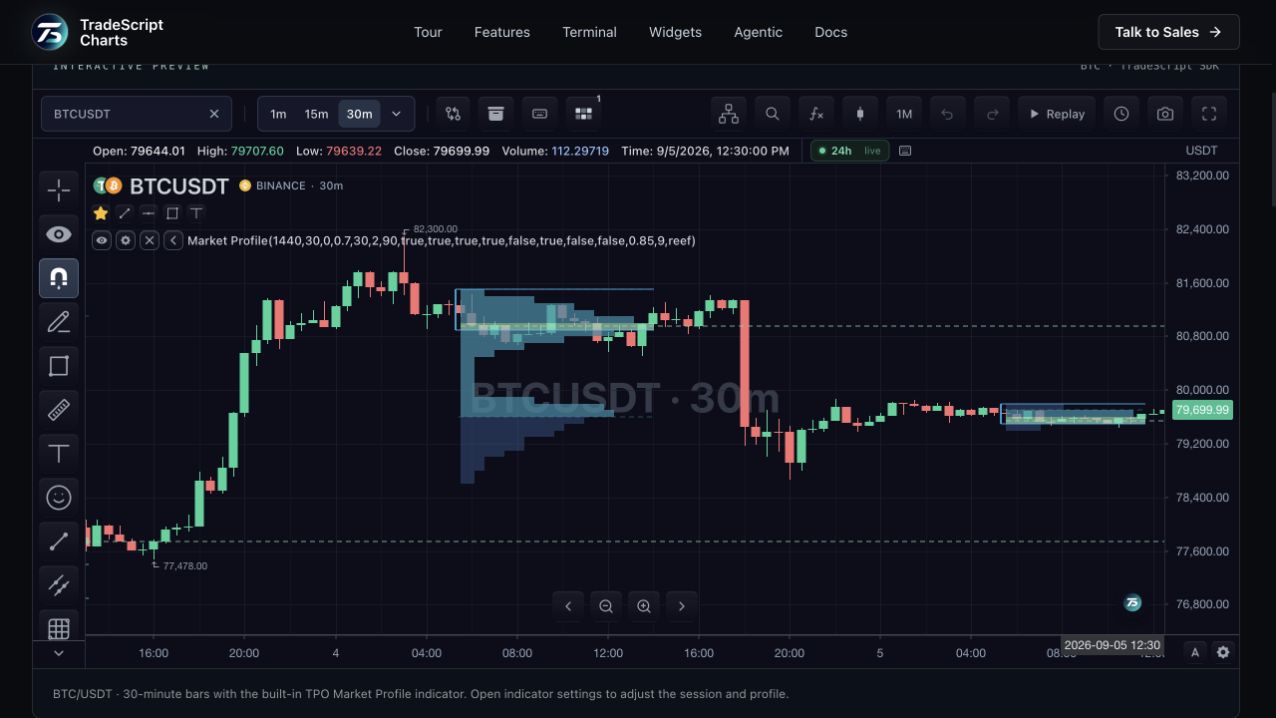
Session profiles organize the chart bars into a distribution by price, with point of control and value-area boundaries. Naked POC lines can remain visible until price returns. Session settings determine how the study groups the available bars.
02
Profile the window you are studying
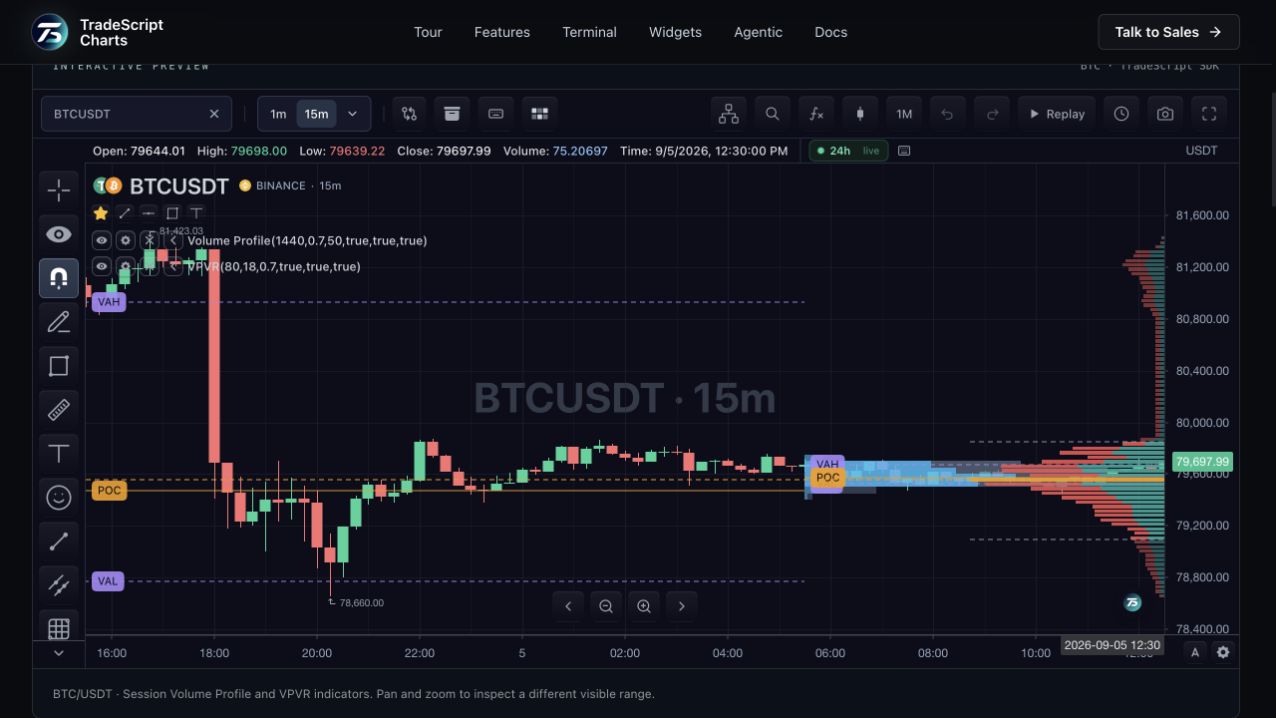
The visible-range profile, or VPVR, summarizes the selected chart window along the price axis. It complements session profiles when the analysis spans only part of a session or crosses several sessions. Pan and zoom to study another range.
03
Understand the available resolution
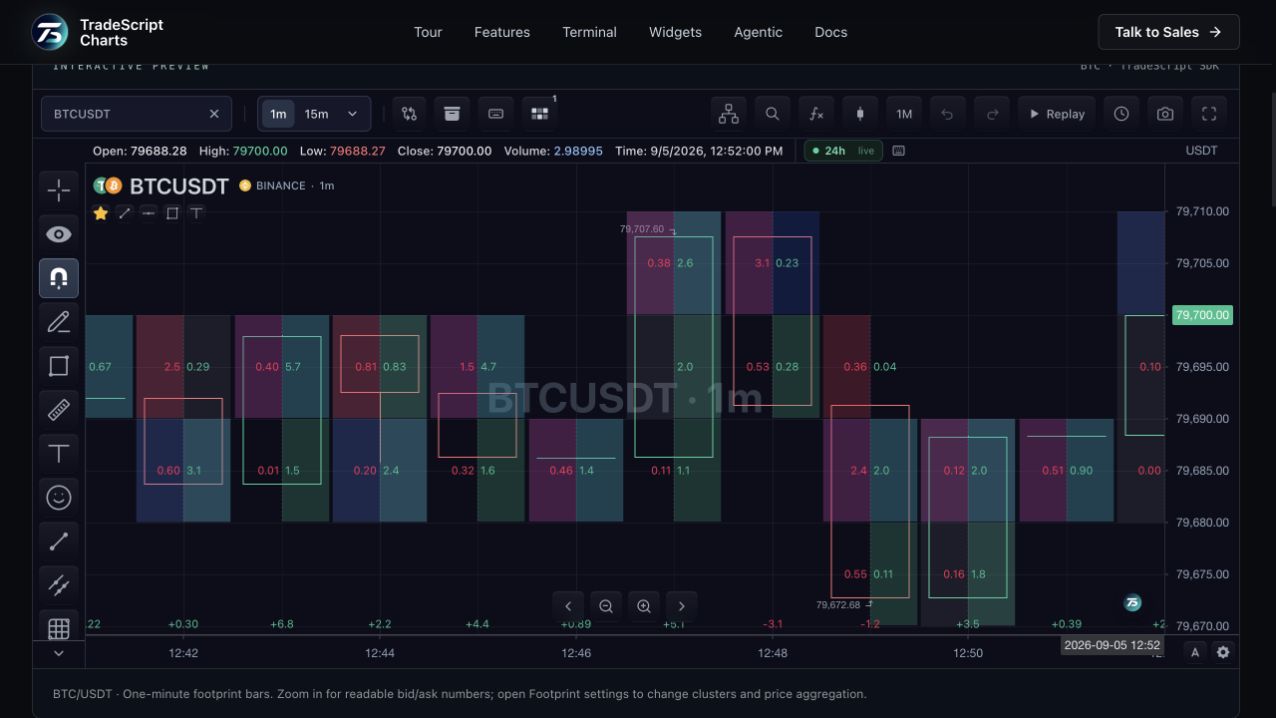
The built-in studies compute from chart bars. They are not a substitute for an execution-by-execution footprint. When a feed supplies taker volume, the study can distinguish that input; when it does not, the chart cannot invent its classification.
How to use volume profile
- Find the session point of control and value area.
- Compare the profile with the visible-range distribution.
- Open indicator settings to change price-level size or sessions.
Data behind this view
Requires volume-bearing chart bars. Resolution follows the bar data; optional taker-volume fields add buying-side information.
Common questions
What is VPVR?
Visible-range volume profile summarizes volume by price within the chart window being inspected.
How is this different from TPO?
Volume profile organizes volume by price; TPO organizes time-price participation.