01
Read resting size through time
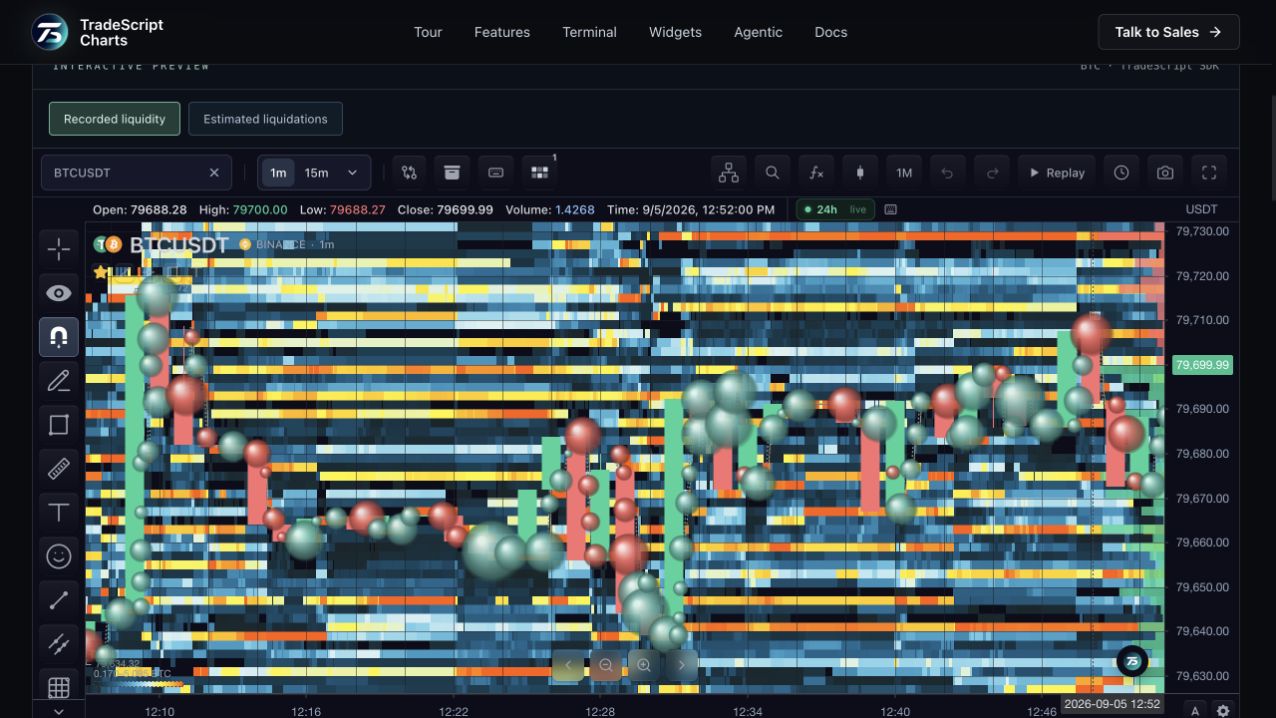
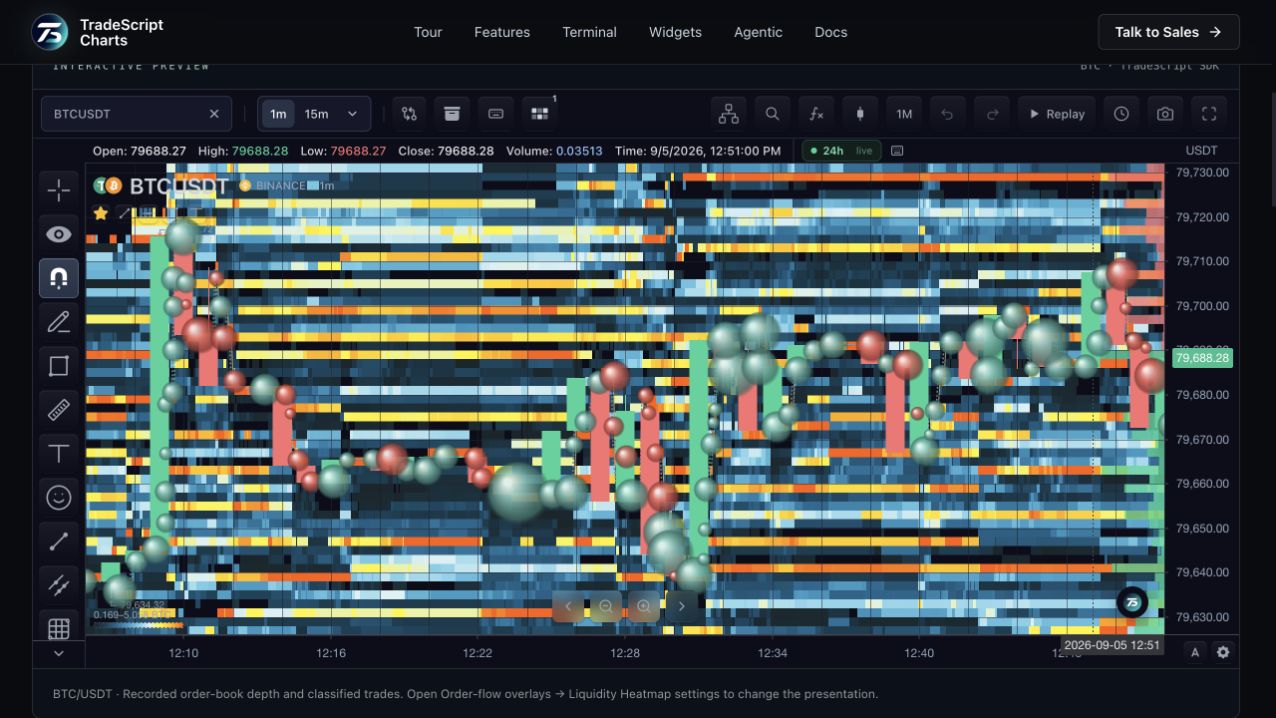
Each column records the order book at a point in time. Brighter price bands represent more resting size under the selected normalization. Follow a band across the chart to see how visible liquidity persists, changes or disappears. An order can be cancelled before execution, so a bright band is context rather than a promise of a fill.
02
Connect liquidity with executed volume
Green and red bubbles represent classified buying and selling from the trade tape. Bubble size expresses aggregated executed volume. These prints are separate from the resting book: the chart does not turn candle volume into invented trades. Historical bubbles return when the connected backend supplies the recorded tape.
03
Choose a useful level of detail
Switch between density, liquidity bands and strong levels. Adjust the palette, cutoffs, smoothing and bubble scale in one settings panel. Zooming and panning keep the heatmap aligned with price and request more detailed recorded book history for the visible window when the feed supports it.
How to use liquidity heatmap
- Drag the BTC chart to inspect earlier depth.
- Open the heatmap settings and try Order book + bubbles.
- Zoom into a short window to inspect changes in individual bands.
Data behind this view
Requires synchronized order-book depth. Historical bands require recorded book snapshots; historical bubbles additionally require classified trade history. Available depth and retention depend on the connected feed.
Common questions
Is this a liquidation heatmap?
No. This heatmap displays resting orders from the order book. A liquidation heatmap displays an independently sourced estimate of leveraged liquidation exposure.
Why is older liquidity sometimes narrower?
The chart can only display levels that were recorded. Increasing backend depth improves new snapshots; it cannot reconstruct deeper levels missing from older snapshots.