01
Read the execution ladder
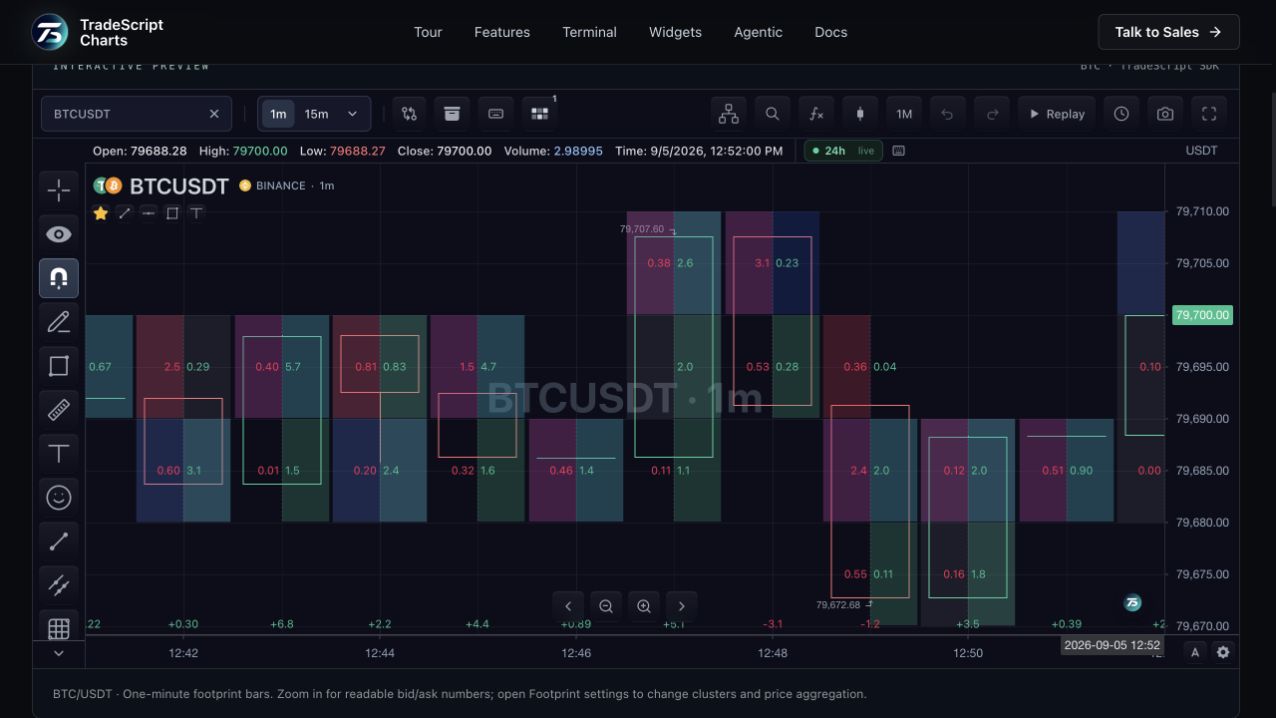
The footprint places classified sell volume and buy volume on opposite sides of each price row. It can show a per-bar volume point of control, a value area and a delta footer. These values require a suitable execution source; ordinary candle totals cannot reveal every traded price.
02
Highlight imbalance with context
Diagonal imbalance compares activity across adjacent price rows according to the configured threshold. Change the level size to aggregate more prices when the chart is crowded. A highlighted imbalance describes the supplied trades and does not by itself predict the next bar.
03
Choose numbers or profiles
The settings support cluster numbers and per-row profile bars, with standard, delta, volume and buy/sell presentations. Colours and aggregation remain chart settings while the source owns trade timestamps, prices, sizes and aggressor classification.
How to use footprint charts
- Zoom until the price rows and numbers are readable.
- Compare buy and sell volume within a candle.
- Open Footprint settings to try profile bars or change the level size.
Data behind this view
Requires historical footprint data or classified time-and-sales that the feed can aggregate. Live tape adds new executions; OHLCV alone is insufficient.
Common questions
What does delta mean?
Delta is classified buy volume minus classified sell volume for the relevant row or bar. Its units follow the instrument quantity.
Why can a footprint be empty while candles load?
The candle feed may be available while the classified trade or footprint history is missing. The chart keeps these data requirements separate.