| View | Source | Represents |
|---|---|---|
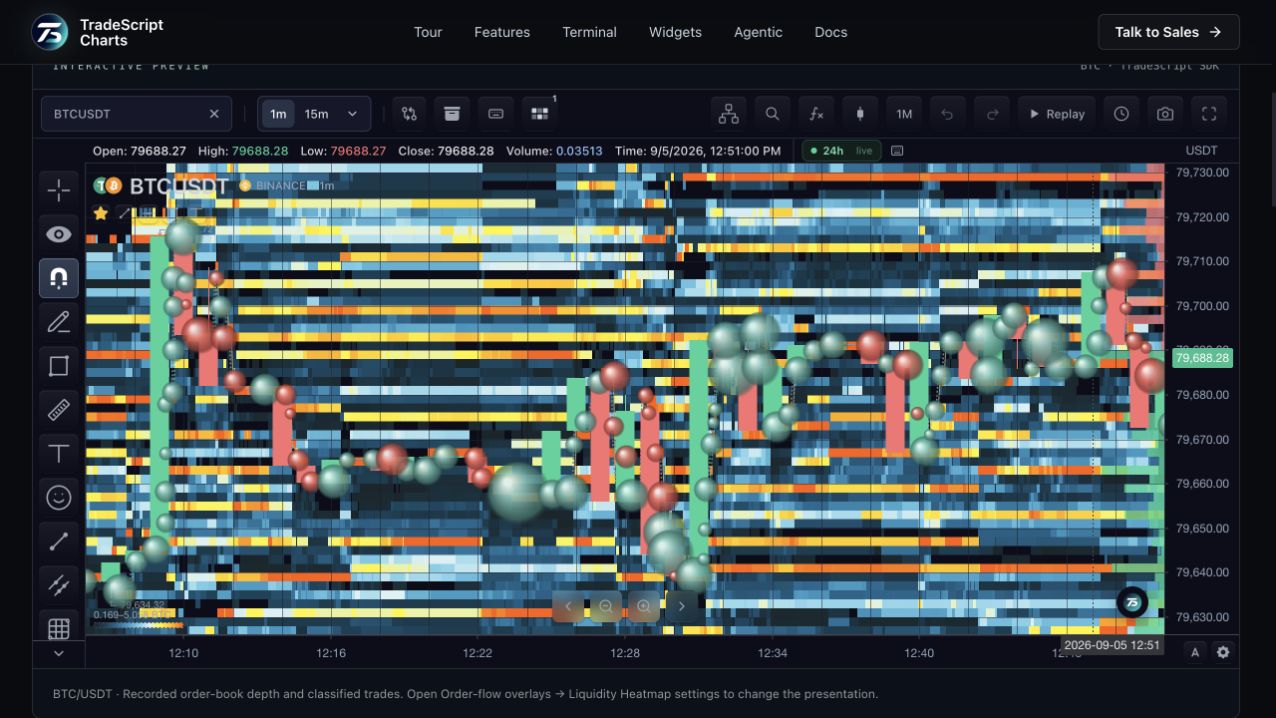
| Liquidity heatmap | Recorded order book | Visible resting bids and asks |
| Trade bubbles | Classified execution tape | Executed buying and selling |
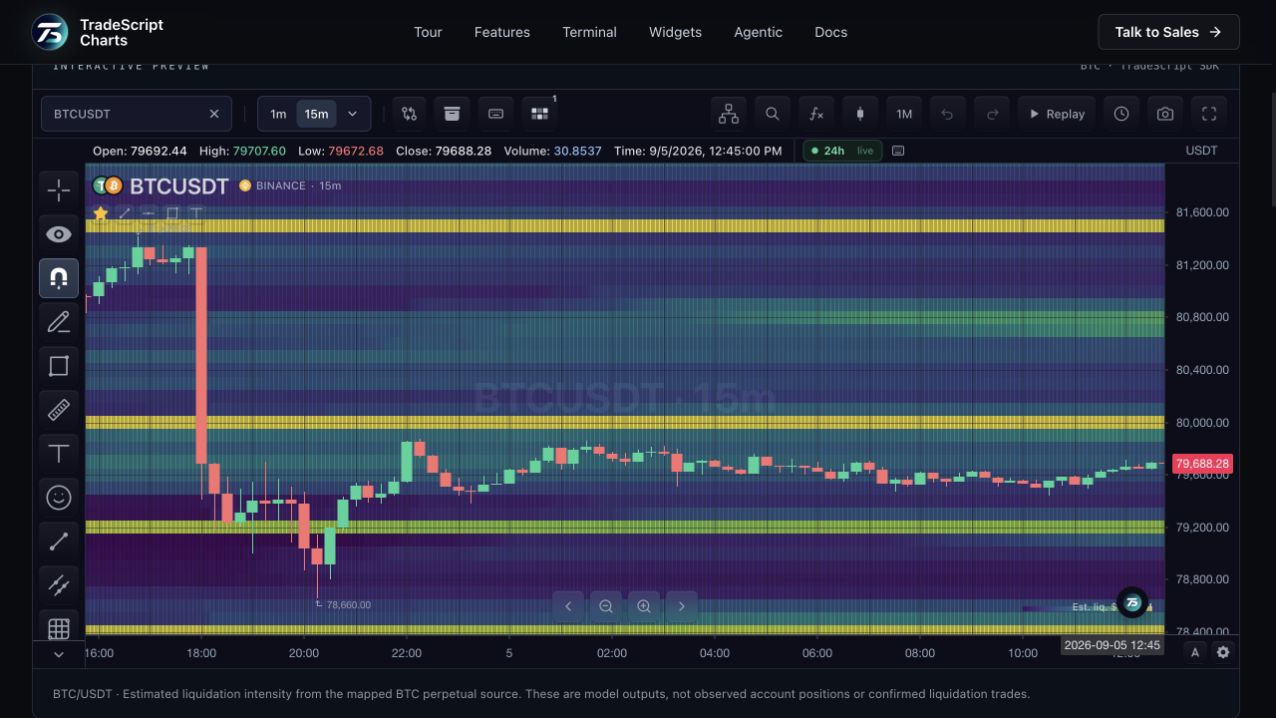
| Liquidation heatmap | Derivatives estimator | Modeled leveraged exposure |
01
Liquidity: what is waiting in the book?
A liquidity heatmap is built from snapshots of resting bids and asks. Brighter bands indicate more visible size under the chosen display scale. The book can change through new orders, cancellations and executions. Historical coverage requires recording those changes; candles do not contain the missing depth.
02
Liquidation: where does a model place exposure?
A liquidation heatmap estimates price levels associated with leveraged positions using derivatives inputs and disclosed assumptions. Its intensity does not mean a matching quantity is waiting in the public order book. A price reaching a band does not guarantee that a particular liquidation will occur.
03
Bubbles: what actually traded?
Buy and sell bubbles visualize classified executions from a trade tape. They commonly accompany an order-book heatmap, but their presence does not make it a liquidation map. The resting book, the execution tape and an estimated liquidation surface are three separate data contracts in TradeScript.
How to use liquidity vs liquidation
- Start with the recorded liquidity view.
- Switch to the estimated liquidation view.
- Compare each view with the same BTC price chart and its source label.
Data behind this view
Order-book history and classified trades power liquidity visuals. An independent derivatives estimator powers liquidation visuals. One source cannot substitute for the other.
Common questions
Which heatmap usually has bubbles?
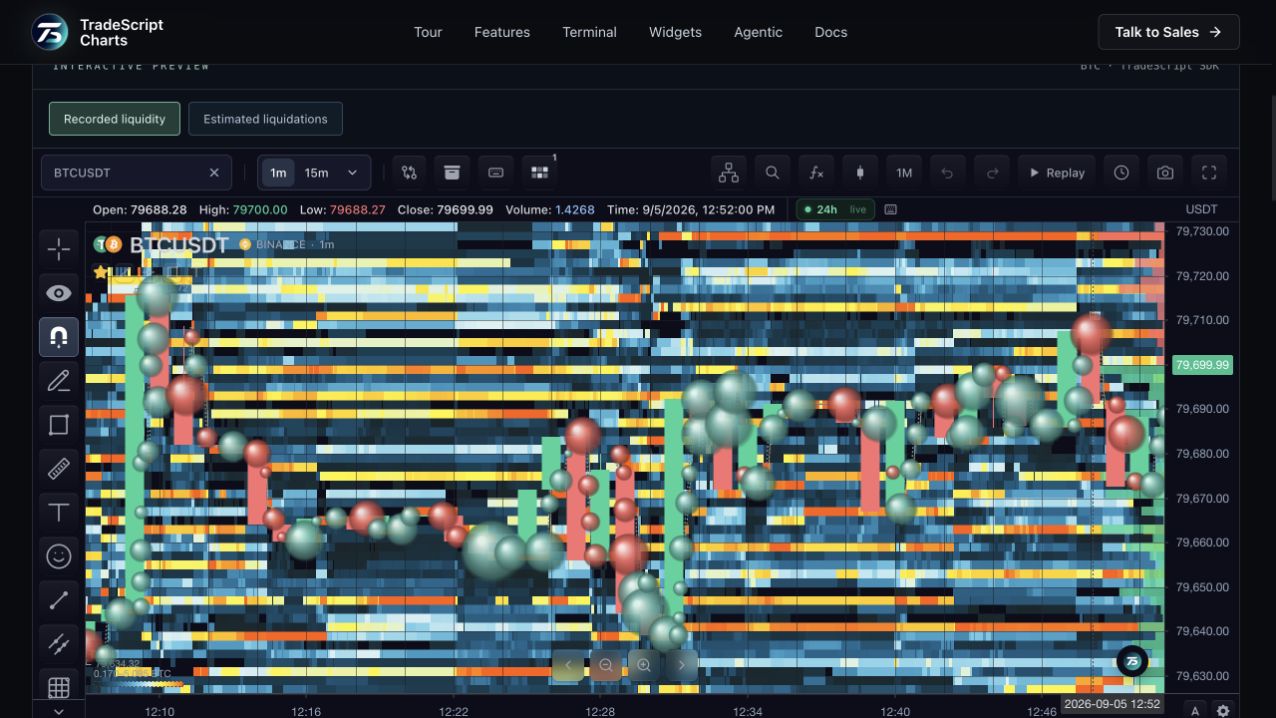
An order-book liquidity heatmap often includes executed trade bubbles. Those bubbles come from a separate trade tape, not from liquidation estimates.
Do brighter colours mean the same thing in both?
No. Liquidity colours express resting size. Liquidation colours express source-defined estimated intensity. Compare each against its own units and normalization.