01
A distinct derivatives data source
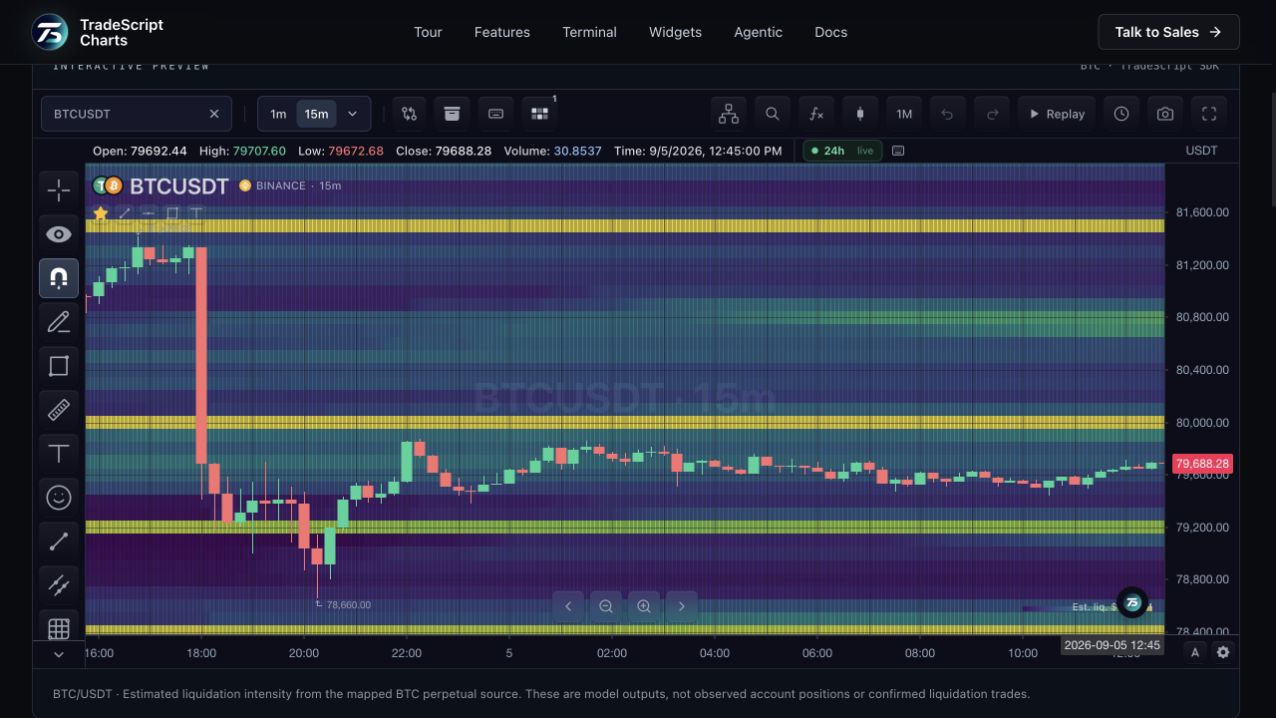
Liquidation intensity comes from a backend estimator rather than the displayed order book. The source supplies the time and price grid, intensity units, reference intensity and method metadata. The chart transports those facts without claiming that modeled exposure is an observed exchange position.
02
Three views of the same estimate
Leverage bands, a density field and strong levels are different presentations of the same source surface. Threshold, palette, opacity and normalization controls change how that surface looks. They do not change its source or convert an estimate into actual liquidation activity.
03
Read the assumptions before the colours
The estimator discloses its leverage allocations, long and short shares, maintenance-margin buffer and exposure-retention assumptions. Those inputs affect the resulting bands. Use the model as additional context and compare it with price and other market information.
How to use liquidation heatmap
- Inspect the estimated BTC perpetual surface.
- Open Liquidation Heatmap settings from Order-flow overlays.
- Compare density and strong-level presentations without changing the source.
Data behind this view
Requires a supported derivatives source and a feed that supplies liquidation heatmap history. Streaming updates are optional. Coverage depends on the source instrument and estimator.
Common questions
Are these actual liquidation orders?
No. The surface is estimated and carries methodology metadata. It is not a list of observed account positions or confirmed liquidations.
Can a spot chart show a liquidation heatmap?
Only when the datafeed explicitly maps it to a supported derivatives source. The source instrument must remain identifiable.