01
Find what is on the chart
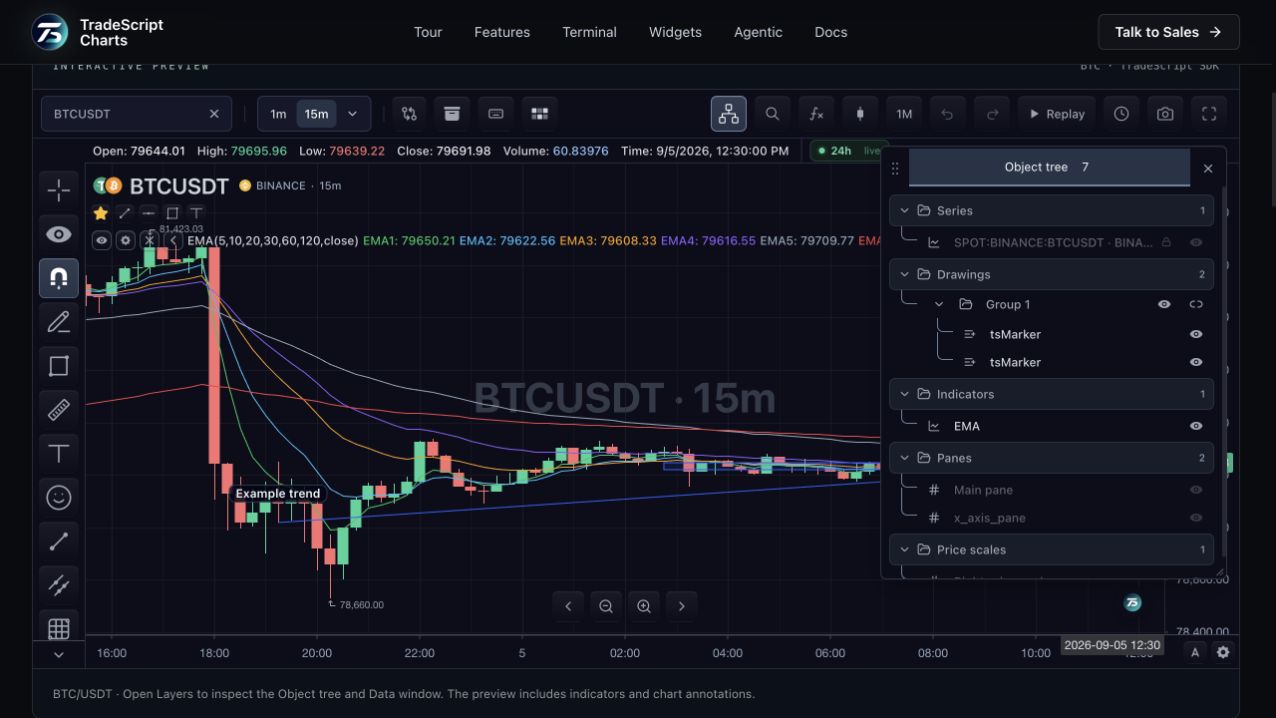
The unified Objects and Data panel includes the main series, indicators, drawings, comparisons and other registered chart objects. Categories make a complex workspace easier to inspect. The Data window provides a separate view of values, while the Object tree focuses on the objects themselves.
02
Manage objects through their identities
Selection, visibility, ordering, grouping, properties and removal act on public object identities. That means an application can connect its own workspace controls to the same objects instead of guessing from a displayed label. Available actions depend on the kind of object.
03
Keep analysis organized
Use groups for related drawings, hide a study while comparing another and return to its settings without searching the canvas. The panel is part of the chart chrome, with configurable placement and a Layers trigger for opening it.
How to use object tree
- Open Layers in the chart toolbar.
- Expand the indicator or drawing category.
- Select an object and inspect its available visibility and property controls.
Data behind this view
Enable the Object Tree feature on the chart. Objects expose the actions supported by their public contracts; provider-owned objects retain their provider ownership.
Common questions
Is the Object Tree only for drawings?
No. It covers series, indicators, comparisons, drawings and other registered chart objects.
Can my application control the same objects?
Yes. Public object identities connect UI operations to the chart API, subject to the capabilities each object exposes.