01
Mark levels, trends and zones
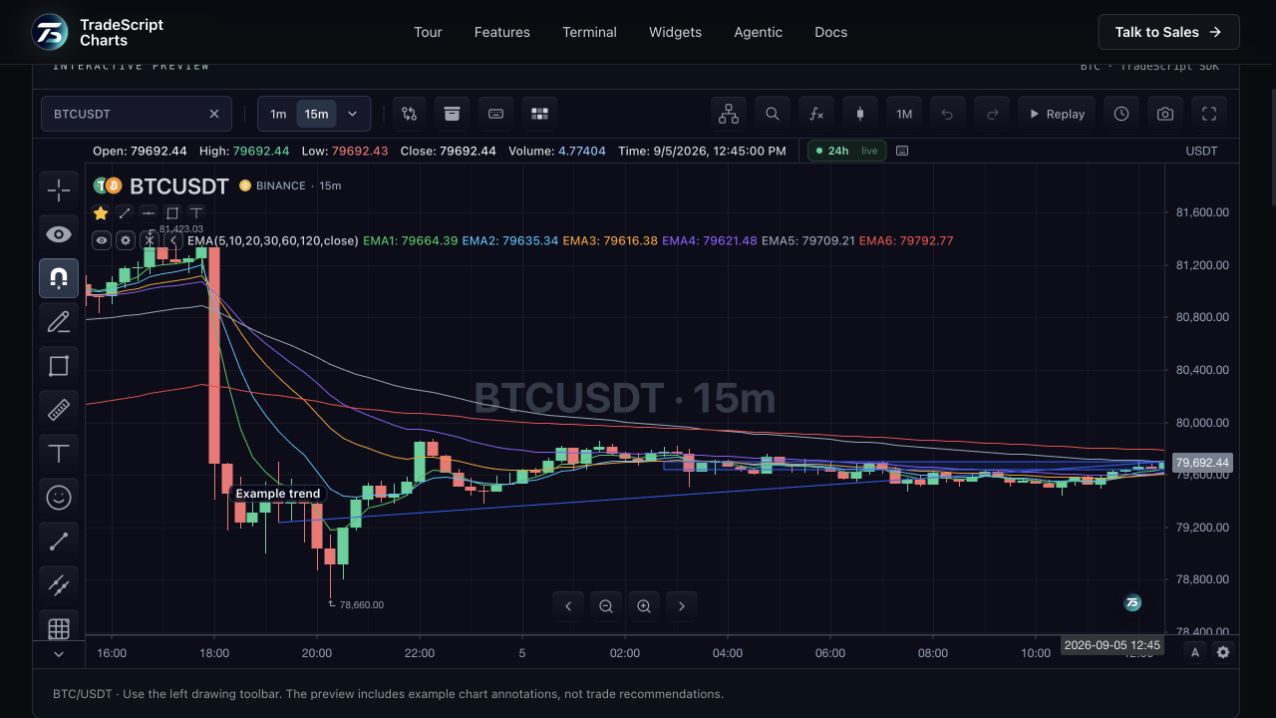
Use the drawing toolbar for lines, rays, boxes, Fibonacci tools and other annotations. Anchor each drawing to the part of price action it describes, then edit its geometry and appearance through chart-native controls.
02
Keep a crowded chart usable
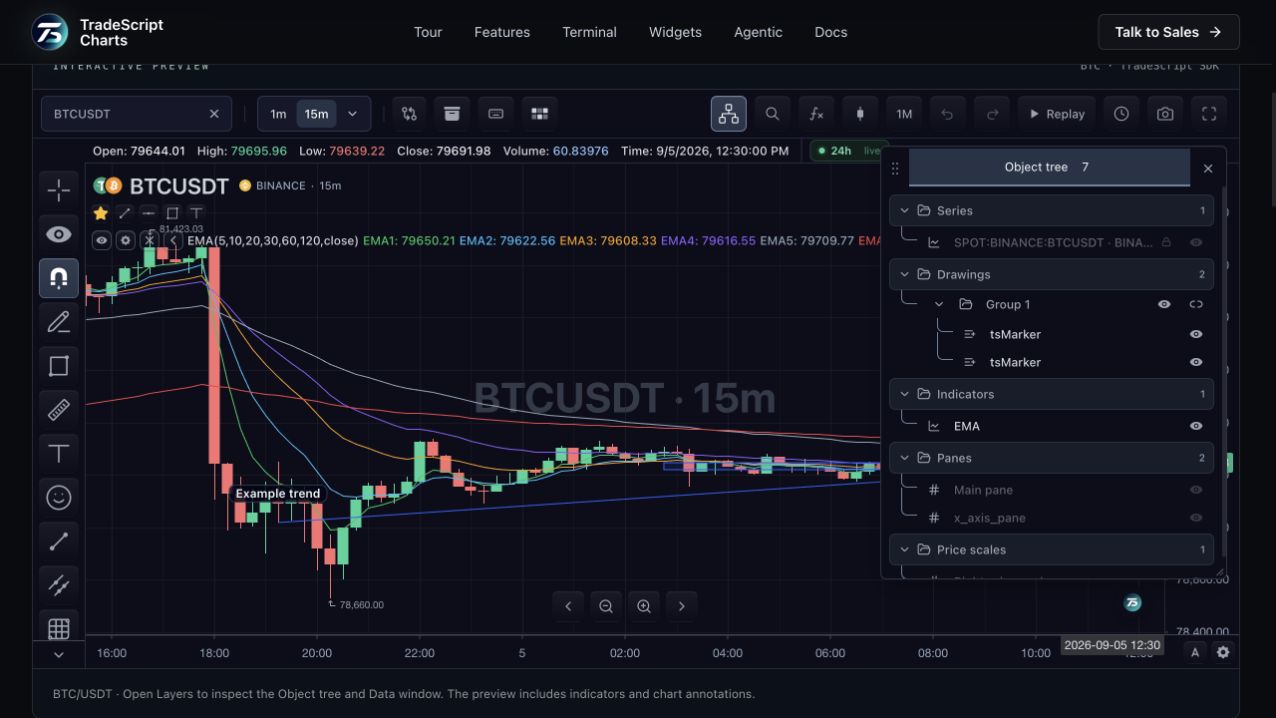
Grouping and visibility help organize a collection of related annotations. The Object Tree makes drawings accessible even when their anchors are outside the visible range. A host can persist drawings through its storage integration.
03
Use the same chart interactions
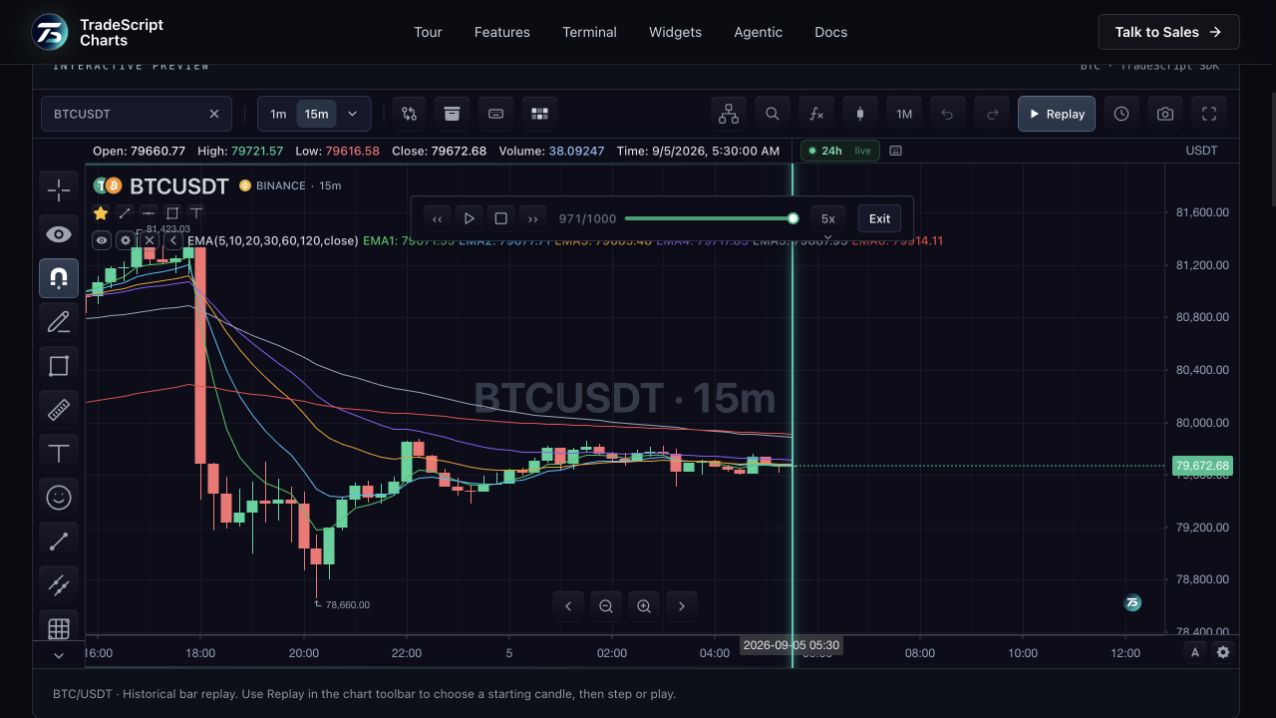
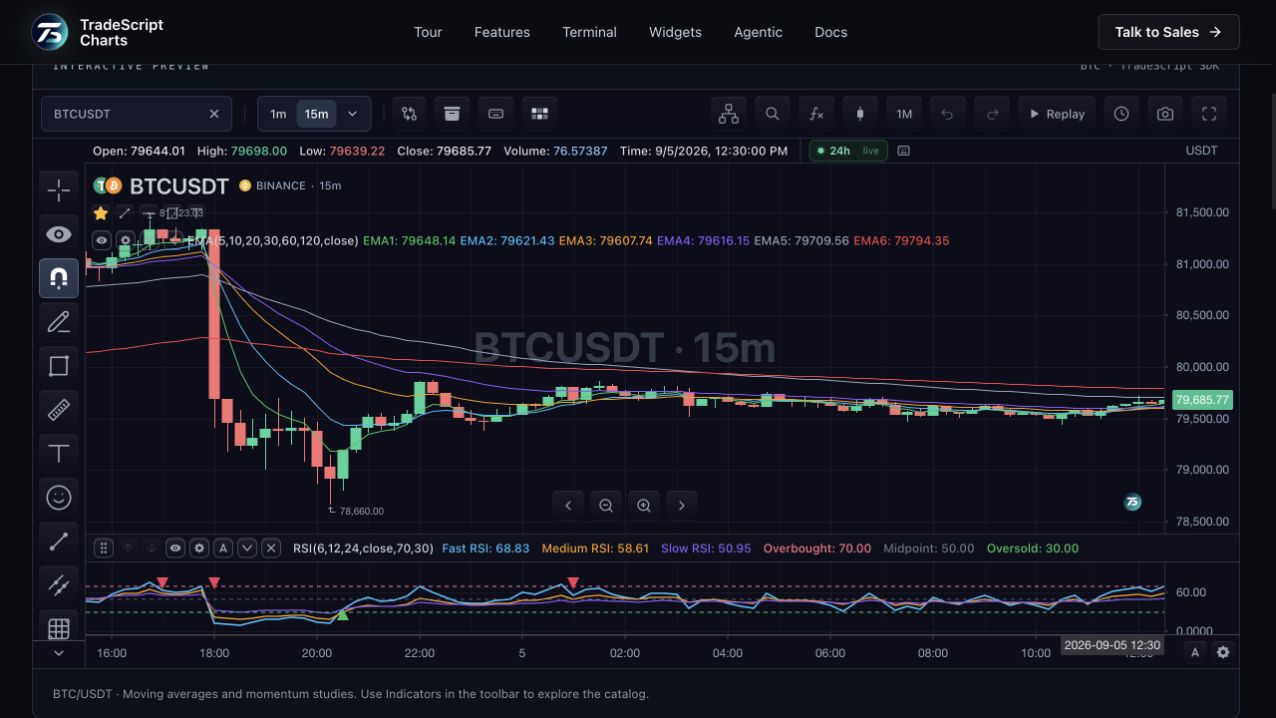
Drawings share the chart time and price coordinates, so panning and scaling preserve their relationship with the series. Combine them with indicators or a replay session to review an idea without moving to another tool.
How to use drawing tools
- Choose a tool from the left toolbar.
- Place its anchors on the chart.
- Open Layers to manage visibility and selection.
Data behind this view
Drawing tools run on chart coordinates. Persistent storage requires a host storage adapter and the appropriate feature configuration.
Common questions
Do drawings move when I pan?
Their anchors remain attached to chart time and price; the chart transforms them with the viewport.
Can I save drawings?
Yes, through the SDK storage integration. The host determines persistence and user context.