Drawing Tools
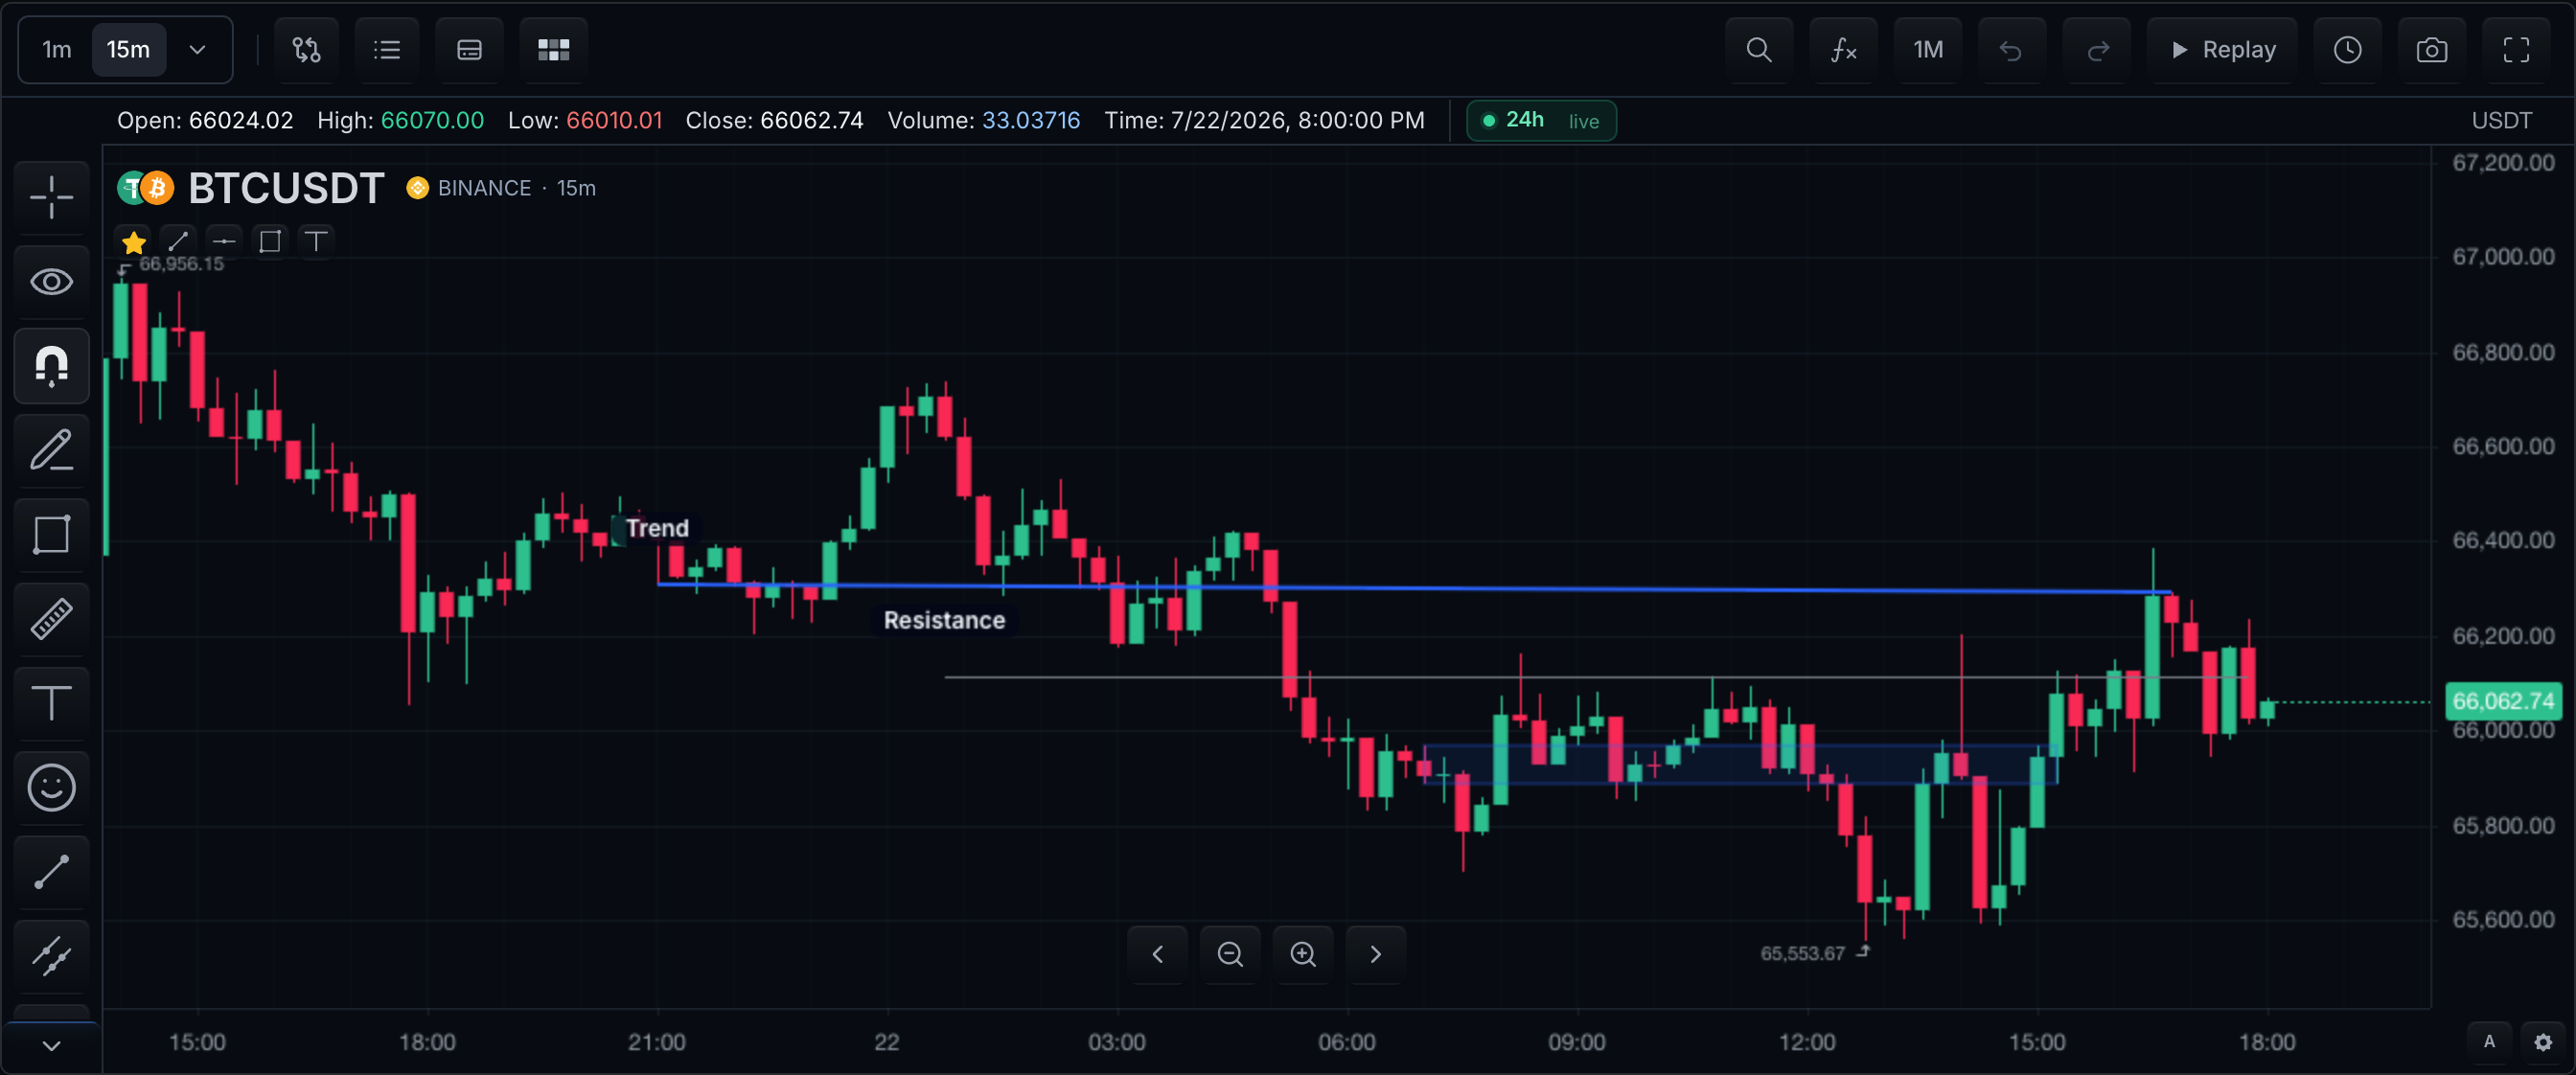
Lines, rays, ranges, Fibonacci tools, text, icons, markers, position tools, and chart annotations are all the same kind of object once they are on the chart. Only their origin differs, and there are exactly three origins:
| Path | Who creates it | Entry point | Details |
|---|---|---|---|
| User-created | The user, interactively | Drawing toolbar or selectDrawingTool | below |
| API-created | The host, programmatically | chart.createDrawing(...) | Overlays |
| Persisted | Restored from storage | loadDrawings / setDrawings | Persistence |
For exact native tool ids, labels, groups, and documented style paths, see the generated Drawing Tool Reference.
User-created drawings
The left drawing toolbar arms a tool; the user then places its anchor points
on the chart. The resulting object is a normal drawing — it appears in
chart.listDrawings() and can be updated, styled, or removed through the same
APIs as API-created drawings.
 Each toolbar entry represents a tool family. Selecting a tool arms interactive placement; the chart leaves placement mode when the drawing completes or is cancelled.
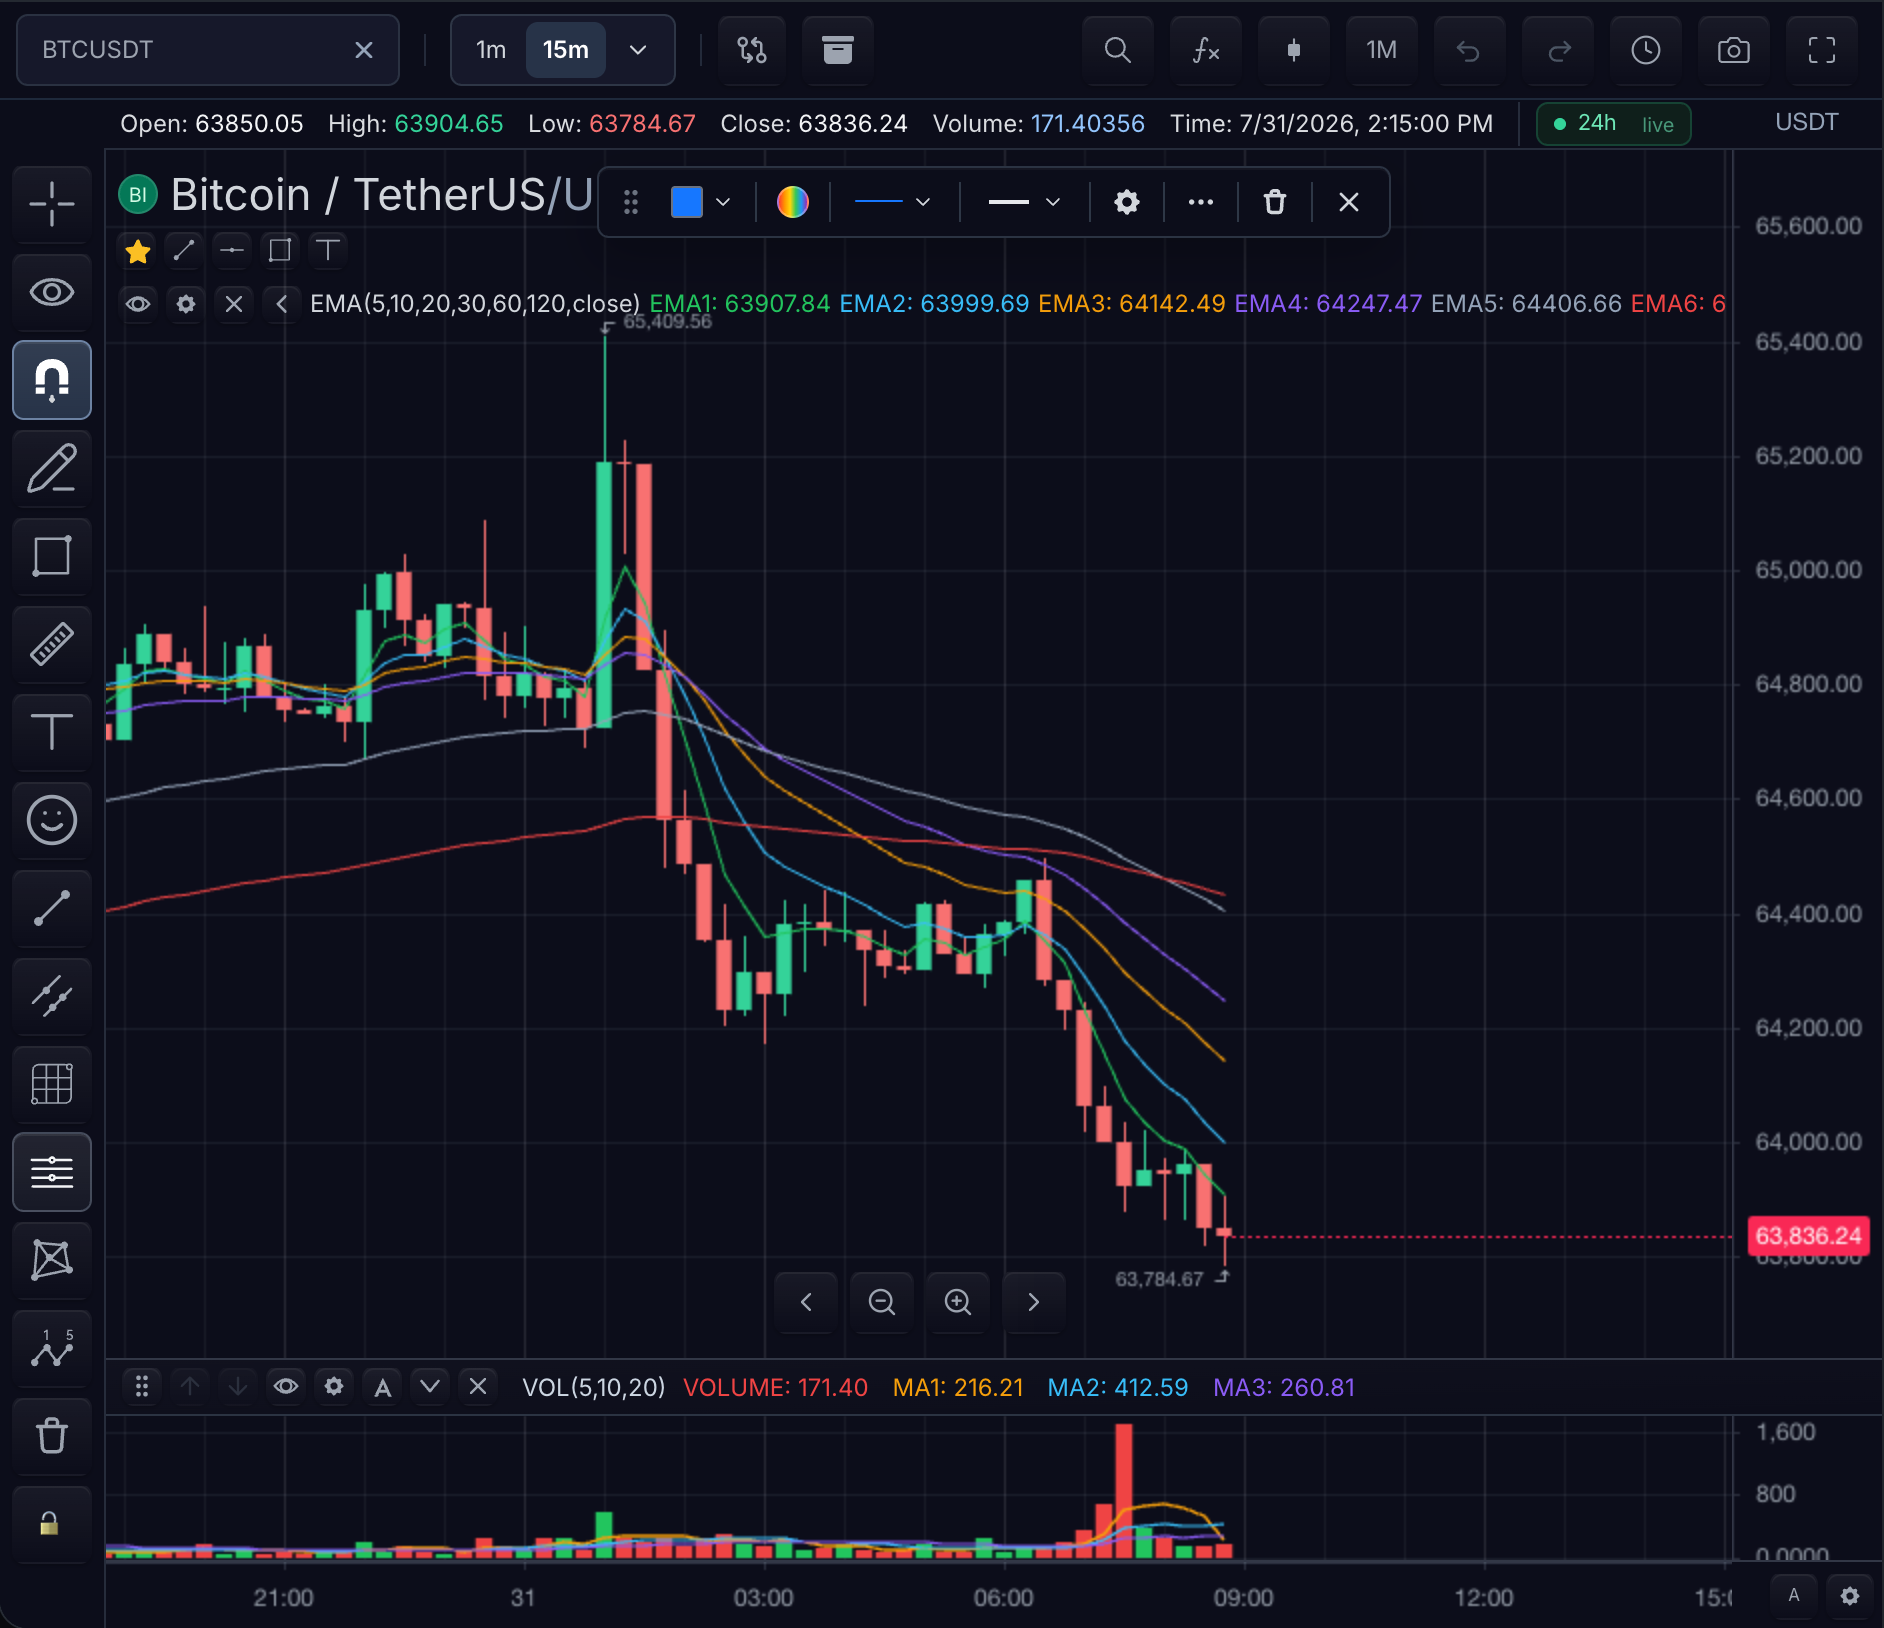 Family flyouts expose the individual tool ids documented in the reference. External toolbars list the same catalog through
 listDrawingTools().
Host code drives the same interactive path:
| Task | TradeScript API |
|---|---|
| List available tools | chart.listDrawingTools() |
| Select a tool for interactive placement | chart.selectDrawingTool(toolId) |
| Read the selected tool | chart.getSelectedDrawingTool() |
| Follow completion or cancellation | chart.on('drawing-tool-change', ...) |
| Set magnet mode | setMagnetMode / getMagnetMode |
External drawing toolbars should use listDrawingTools() for the catalog,
selectDrawingTool(toolId) to arm placement, and
on('drawing-tool-change', ...) to follow completion or cancellation.
Line labels
Every line tool can carry its own text label — there is no separate "labelled
line" tool. Hover a placed line and an + Add text prompt appears at its
midpoint; click it and type. The label follows the line's angle and moves with
it, and the styling turns bare text into a badge.
 One label mechanism, three shapes.
 borderVisible turns text into a badge; borderRadius decides square or pill; textPosition places it above, on, or below the line.
The text lives in metadata.lineText and the badge styling in
metadata.styles.*:
| Control | Style path | Notes |
|---|---|---|
| Label text | metadata.lineText | Empty or absent means no label |
| Position | metadata.styles.textPosition | above (default), center, below |
| Type | metadata.styles.textColor / fontSize / fontWeight / fontStyle | Text color falls back to the line color |
| Background | metadata.styles.backgroundVisible / backgroundColor / backgroundOpacity | Off by default |
| Border | metadata.styles.borderVisible / borderColor / borderSize / borderStyle | Border color falls back to the line color |
| Shape | metadata.styles.borderRadius | 0 is a square badge; higher values round it into a pill |
| Padding | metadata.styles.paddingX / paddingY | Widens automatically once the label becomes a badge |
import type { ChartApi } from '@tradescript/pro/sdk/core';

declare const chart: ChartApi;

await chart.createDrawing({
  type: 'horizontalStraightLine',
  points: [{ time: 1719878400000, value: 105.52 }],
  styles: { line: { color: '#2962FF', size: 1 } },
  metadata: {
    lineText: 'Support 105.52',
    styles: {
      textPosition: 'center',
      borderVisible: true,
      borderRadius: 13,
      backgroundVisible: true,
      backgroundColor: '#0b1017',
    },
  },
});
Users reach the same controls through the line's settings panel: select the line, open its gear, and the Text section holds position, type, background and border. The exact set of label paths a tool publishes is listed per tool in the generated Drawing Tool Reference — a line tool that renders no label publishes none of them.
API-created drawings
The host creates drawings directly from data — no user interaction involved. The full create/update/style/remove workflow lives in Overlays; the core operations are:
| Task | TradeScript API |
|---|---|
| Create a drawing | chart.createDrawing(drawing) |
| Read or list drawings | chart.getDrawing(id) / chart.listDrawings() |
| Update or remove | chart.updateDrawing(id, patch) / chart.removeDrawing(id) |
| Change visibility, lock, or order | setDrawingVisibility, setDrawingLock, setDrawingZOrder |
| Group or ungroup | groupDrawings, ungroupDrawings |
import type { ChartApi } from '@tradescript/pro/sdk/core';

declare const chart: ChartApi;

const drawingId = await chart.createDrawing({
  type: 'segment',
  points: [
    { time: 1719878400000, value: 188.2 },
    { time: 1720137600000, value: 194.6 },
  ],
  styles: { line: { color: '#1677FF', size: 1 } },
});

await chart.updateDrawingProperties(drawingId, {
  styles: { line: { color: '#22c55e' } },
});
After the create call, a straight segment connects the two data-space anchor points on the main pane; after the update, the same drawing (same id) renders green instead of blue.
Native drawing handles
Use chart.getDrawing(id) for a cloned snapshot of one drawing. Use chart.duplicateDrawing(id, overrides?) to clone an existing drawing while deep-merging styles and metadata. Use chart.getDrawingHandle(id) for repeated reads, catalog-validated property edits, point edits, duplication, visibility, lock state, z-order, grouping, and removal. The handle uses the same public behavior as the direct drawing methods.
Symbol and image drawings
Use icon and emoji drawings for glyph-backed symbols, including explicit metadata.value and optional metadata.styles for color, size, weight, and font family. Use image drawings for application-owned visual assets. Provide TradeScript drawing options directly; external asset identifiers are not drawing options.
Styling defaults
Use chart.customization().setDrawingDefaultStyles(toolId, styles) to set documented style paths for future drawings created with a specific tool ID. Entries under metadata set documented controls such as arrow heads, bar-pattern type, simulation, and label/card fields. Existing drawings keep their current values until you update that drawing.
Only use style paths listed in the Drawing Tool Reference. A drawing tool with no listed style paths does not have a public default-style schema yet.
validateCustomizationState(...) validates drawingDefaultStyles against the native catalog. inspectDrawingNativeStyles(toolId, styles) exposes the same catalog check for create/update flows. updateDrawingProperties(...) rejects unsupported native style fields before mutation and deep-merges nested styles and metadata; updateDrawing(...) remains an open patch channel and reports validation warnings for unsupported style fields on known native drawing tools without rewriting the host payload.
Persisted drawings
Drawings survive reloads through the storage path — snapshot APIs on the
chart plus a ChartStorageAdapter owned by the host. The ownership diagram,
identity rules, and failure behavior live in Persistence.
| Task | TradeScript API |
|---|---|
| Snapshot all drawings | getDrawings, setDrawings |
| Persist separately | saveDrawings, loadDrawings |
The SDK exposes DrawingDefinition, DrawingSnapshot, and DrawingState
for drawing persistence. A restored drawing keeps its id, geometry, styles,
visibility, lock state, grouping, and z-order — it is indistinguishable from
the moment it was saved.
Smart drawings
Smart drawings sit between indicators and hand-placed drawings: the chart
computes them from your bars in the chart worker and projects the results onto
locked overlays marked Auto. Toggling one never arms the pointer, and the
overlays it produces stay out of drawing storage, sharing, undo, and user
drawing counts.
| Tool | What it finds |
|---|---|
autoLevels | Session high and low, previous-day high and low, premarket high and low, and the opening range |
autoLevelsRange | The high and low of a span you draw, plus the support and resistance solved from the price action inside it |
autoLevelsVisible | The same levels, solved from the bars currently on screen and re-solved as you pan and zoom |
hodLodBreak | Bars that take out the running session high or low |
vwapBreak | Session-anchored VWAP plus the closes that cross it |
patternRecognition | Double top and bottom, head and shoulders and its inverse, and ascending, descending, and symmetrical triangles |
What your feed must supply first
Smart drawings compute from your bars, so three source facts decide whether they can produce anything. Each missing fact is reported as a typed state, never guessed around — if you enable the tools and see nothing drawn, check these before anything else.
| Requirement | Supplied by | Missing it means |
|---|---|---|
| Session windows | MarketDataFeed.resolveSessionCalendar plus supportsSessionCalendar | Every tool reports session-calendar-unavailable and draws nothing |
| Bar finality | Bar.state on history and realtime, plus supportsBarFinality | Bar-close confirmation reports bar-finality-unavailable; switch a tool to intrabar to run without it |
| Volume | Bar.volume on every session bar | VWAP reports volume-unavailable; absent volume is never treated as zero |
Adding a session calendar has one visible side effect worth knowing before you
ship it: session background shading is on by default, so the chart starts
painting pre-market, regular, and after-hours bands across the plot. That is
sessionBackground.show in chart settings — turn it off through
displaySettings if you want the calendar's precision without the bands.
sdk.chart.mount({ ...options, displaySettings: { sessionBackground: false } });
Pick a schedule that matches the instrument, too. A 24/7 symbol on an equities
calendar spends most of its time outside regular hours, and the session-scoped
tools (HOD/LOD Break, VWAP Break) will have no current session to work in even
though Auto Levels still returns previous-session levels. Use
CONTINUOUS_SESSION_SCHEDULE for crypto and US_EQUITIES_SESSION_SCHEDULE for
listed equities.
The session calendar is the one most integrations miss. Build one from a declarative schedule:
import { US_EQUITIES_SESSION_SCHEDULE, createSessionCalendarProvider } from '@tradescript/pro/sdk';

const sessionCalendar = createSessionCalendarProvider(US_EQUITIES_SESSION_SCHEDULE);

const feed: MarketDataFeed = {
  ...yourFeed,
  onReady: async () => ({ ...(await yourFeed.onReady?.()), supportsSessionCalendar: true }),
  resolveSessionCalendar: async (request) => await sessionCalendar(request),
};
Enable the tools
Listing a tool in tools offers it in the toolbar; it stays switched off until
someone toggles it. Use enabledByDefault when you want results on first paint.
A user's saved choice always wins over both.
const widget = sdk.chart.mount({
  mount: '#chart',
  symbol: 'BTCUSDT',
  interval: '1m',
  datafeed: feed,
  features: {
    smartDrawings: {
      enabled: true,
      tools: ['autoLevels', 'hodLodBreak', 'vwapBreak', 'patternRecognition'],
      enabledByDefault: ['autoLevels', 'vwapBreak'],
      defaults: {
        autoLevels: { openingRangeMinutes: 15 },
        hodLodBreak: { confirmation: 'bar-close' },
        vwapBreak: { confirmation: 'bar-close', source: 'hlc3-volume' },
        patternRecognition: { confirmedOnly: true, maxResults: 20 },
      },
    },
  },
});

const chart = widget.chart();
chart.setSmartDrawingEnabled('autoLevels', true);
chart.updateSmartDrawingSettings('autoLevels', { openingRangeMinutes: 30 });

const state = chart.getSmartDrawingState('autoLevels');
chart.dismissSmartDrawingResult('autoLevels', state.results[0].resultId);
const keptId = chart.keepSmartDrawingResult('autoLevels', state.results[1].resultId);
Tune the solved levels
autoLevelsRange and autoLevelsVisible solve support and resistance from the
bars in their span. Prices the market was rejected at are resistance and prices
it bounced off are support, so an area that flipped reports as one of each.
Each solved level arrives as two results that share a colour: a zone tinting
the band its touches fell in, and a horizontal-level at the band's midline,
labelled with its side and touch count. Resistance is red and support is green;
the span's own high and low take amber and sky so those two colours only ever
mean support and resistance.
maxResults defaults to 6 and is split between the two sides, so both are
represented whichever is stronger. Four more settings control the solver.
| Setting | Controls |
|---|---|
pivotWing | Bars either side of a turn before it counts as a pivot. Raise it for fewer, more structural levels |
minimumTouches | Turns a price must have produced before it is reported |
zoneWidthAtrPercent | Half-height of each band as a percentage of ATR, which also decides whether two nearby touches are one level or two |
zones | Set false to draw the midlines without the bands |
chart.updateSmartDrawingSettings('autoLevelsVisible', {
  pivotWing: 5,
  minimumTouches: 3,
  zoneWidthAtrPercent: 60,
  maxResults: 6,
});
keepSmartDrawingResult is the only path that turns a computed result into a
normal drawing. The copy it creates is editable, persistent, and yours; the
managed original is suppressed so you do not end up with two of them. Dismissing
a result suppresses its stable id so it does not reappear on the next
recalculation, scoped to the tool, symbol, and interval.
Smart drawings never infer a fact they were not given. Bar-close confirmation
needs real finality, so set Bar.state to final or developing on both
history and realtime updates and declare supportsBarFinality on the feed —
finality is never derived from a bar timestamp or the wall clock. Session windows
come from resolveSessionCalendar, volume is required for VWAP, and an absent
volume is never treated as zero. When a required fact is missing the tool reports
a typed state such as bar-finality-unavailable, session-calendar-unavailable,
or volume-unavailable instead of guessing.
Detection runs only in the chart worker; there is no main-thread fallback, so a
disabled or failed worker leaves tools reporting worker-unavailable.
Next steps
- Drawing Tool Reference — every tool's id, family, capabilities, and supported style paths.
- Overlays — create, update, style, and remove drawings through
ChartApi. - Drawing Persistence — the save and restore sequence, identity, and versioning rules.
- Drawing Storage — embedded versus separate storage records in your backend.