01
Start with familiar studies
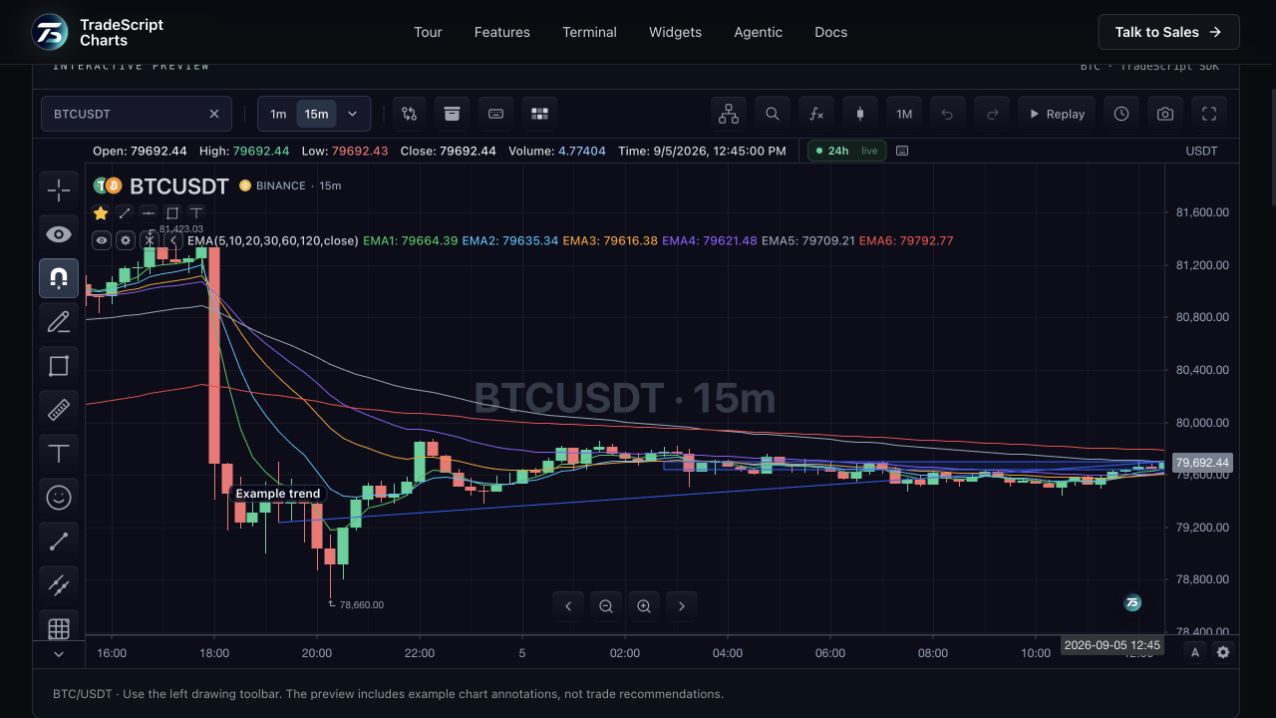
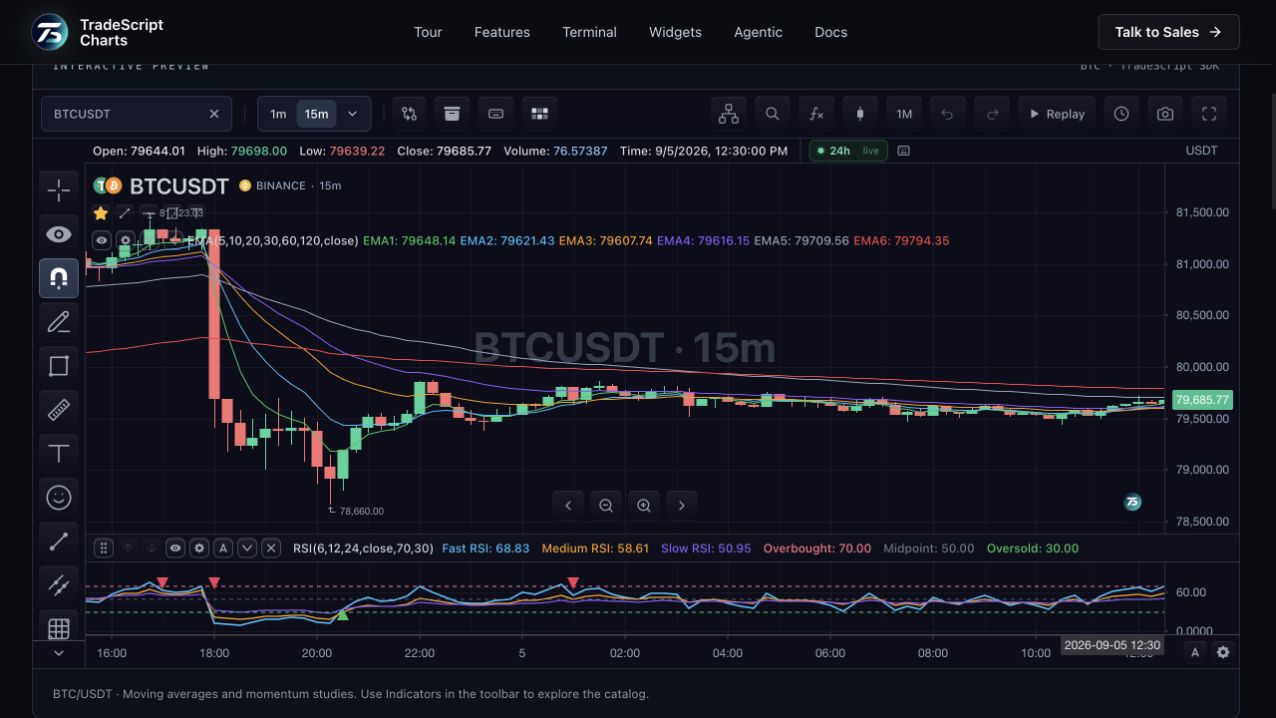
The built-in catalog includes moving averages, volatility bands, momentum studies and volume-based indicators. An overlay stays beside price while a pane study gets its own scale. The preview combines EMA and RSI so both kinds of study are visible.
02
Tune inputs and presentation
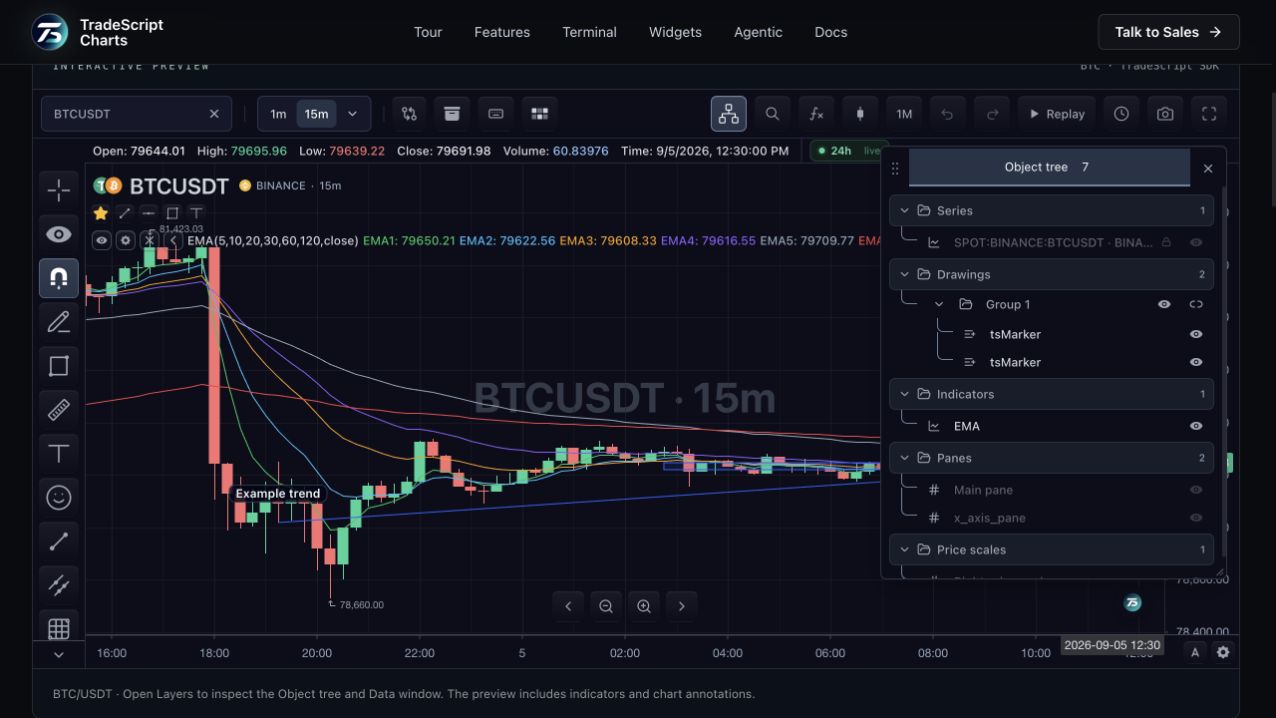
Indicator settings keep parameters and styles attached to the study. Change a period, adjust colours or hide an indicator while comparing another view. The legend and Object Tree provide routes back to the same study.
03
Extend the chart with your own logic
The SDK also supports custom indicator integration through its documented indicator interfaces. Data dependencies remain explicit: a study requiring funding, open interest or another field needs a feed that actually provides that field.
How to use technical indicators
- Open the Indicators catalog.
- Add a study and inspect its legend values.
- Change its settings or hide it from the Object Tree.
Data behind this view
Basic studies use OHLCV bars. Indicators with additional data inputs need those inputs from the connected feed.
Common questions
Can I add a proprietary indicator?
Yes. The SDK documents custom indicator integration and its inputs, outputs and lifecycle.
Are all studies valid on every market?
No. The required source fields and session assumptions must be available for the selected instrument.