01
Give each view a purpose
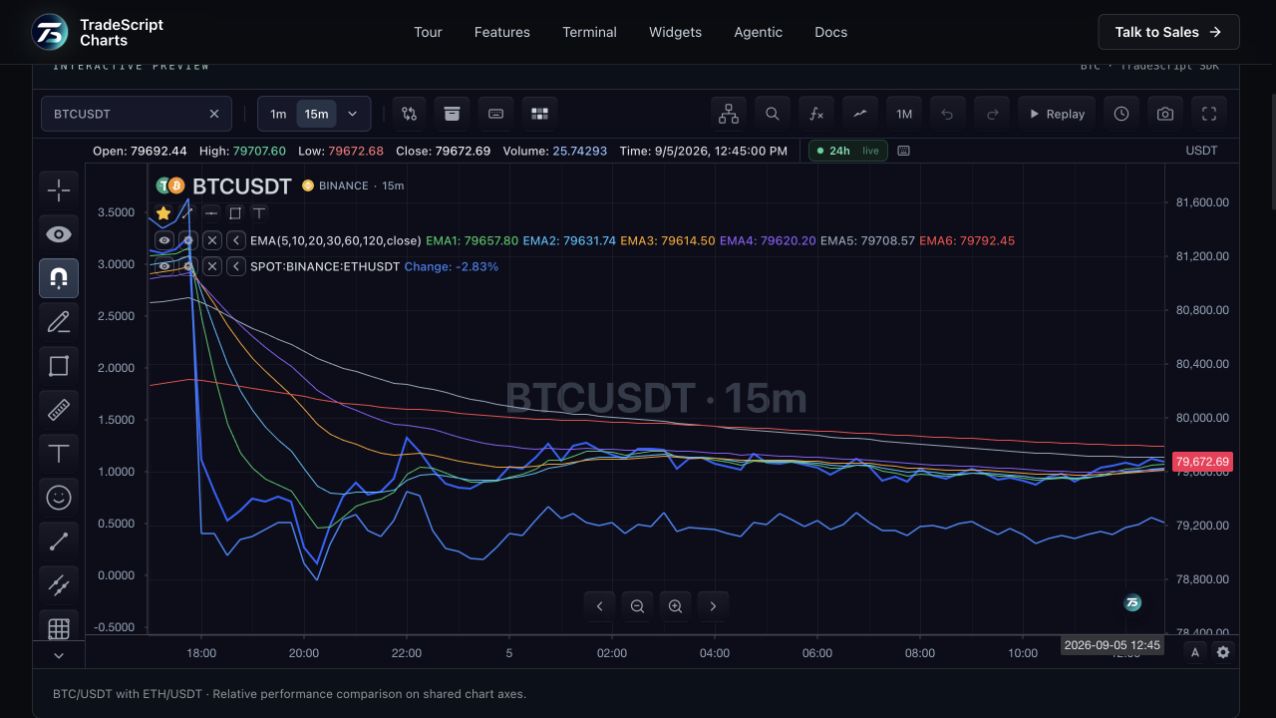
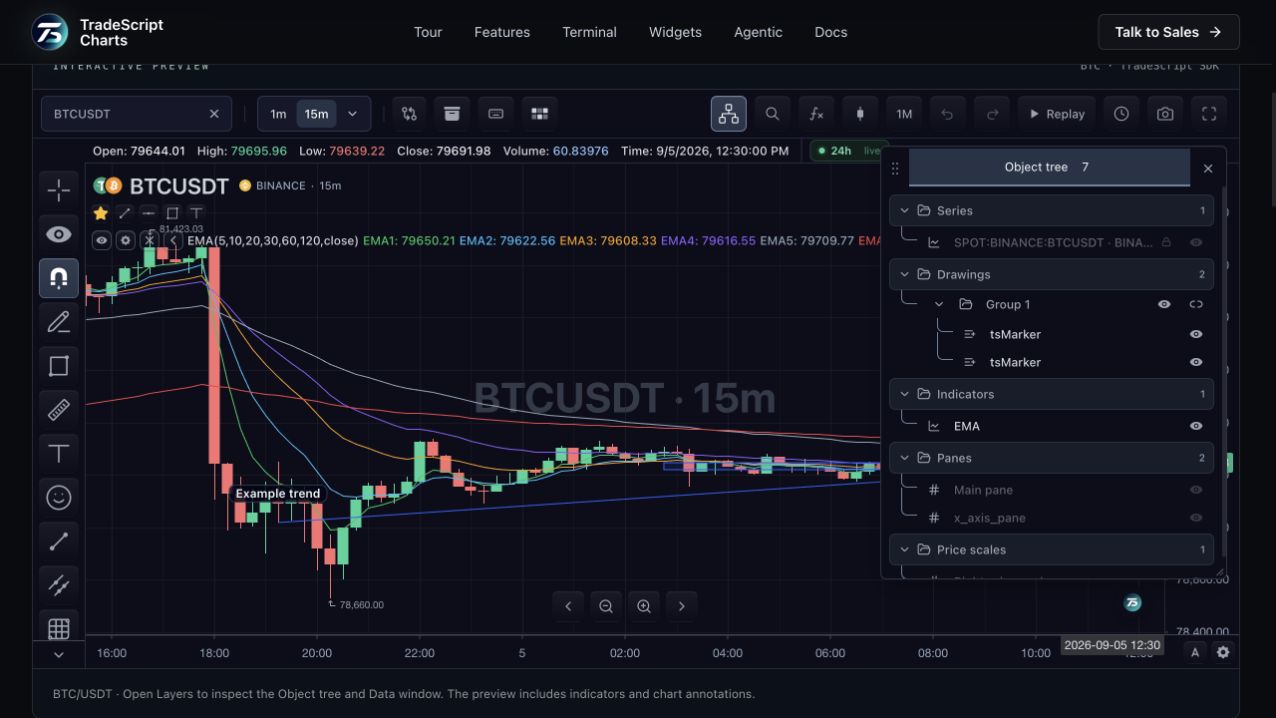
A short interval can describe recent price action while a longer interval supplies context. The linked workspace presents multiple chart panes with layout and synchronization controls. Each instance has its own scale and study configuration.
02
Choose what the workspace shares
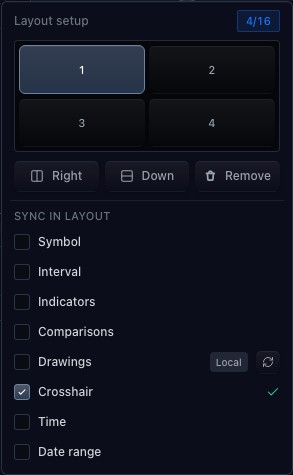
The SDK multi-chart surface supports layout and synchronization configuration. A host can define how chart selection and shared interactions work instead of coupling every chart indiscriminately. The full terminal provides a broader workspace demonstration.
03
Integrate the surrounding product
Charts can live beside watchlists, account views and other widgets. The host application owns the arrangement, datafeed and storage lifecycle. Keep those responsibilities explicit when persisting a user workspace or moving between instruments.
How to use multi-chart layouts
- Compare the short and longer BTC intervals.
- Inspect indicators or drawings in either preview.
- Open the terminal to explore the full workspace.
Data behind this view
Requires data for each chart instance. Layout persistence and synchronization are configured by the host application.
Common questions
Must every chart use the same symbol?
No. A host can configure different symbols or multiple intervals of one instrument.
Are these two preview charts synchronized?
Open the workspace demonstration to explore its layout and synchronization controls. The host chooses which symbol, interval, crosshair and drawing interactions to share.