01
Put different price scales in context
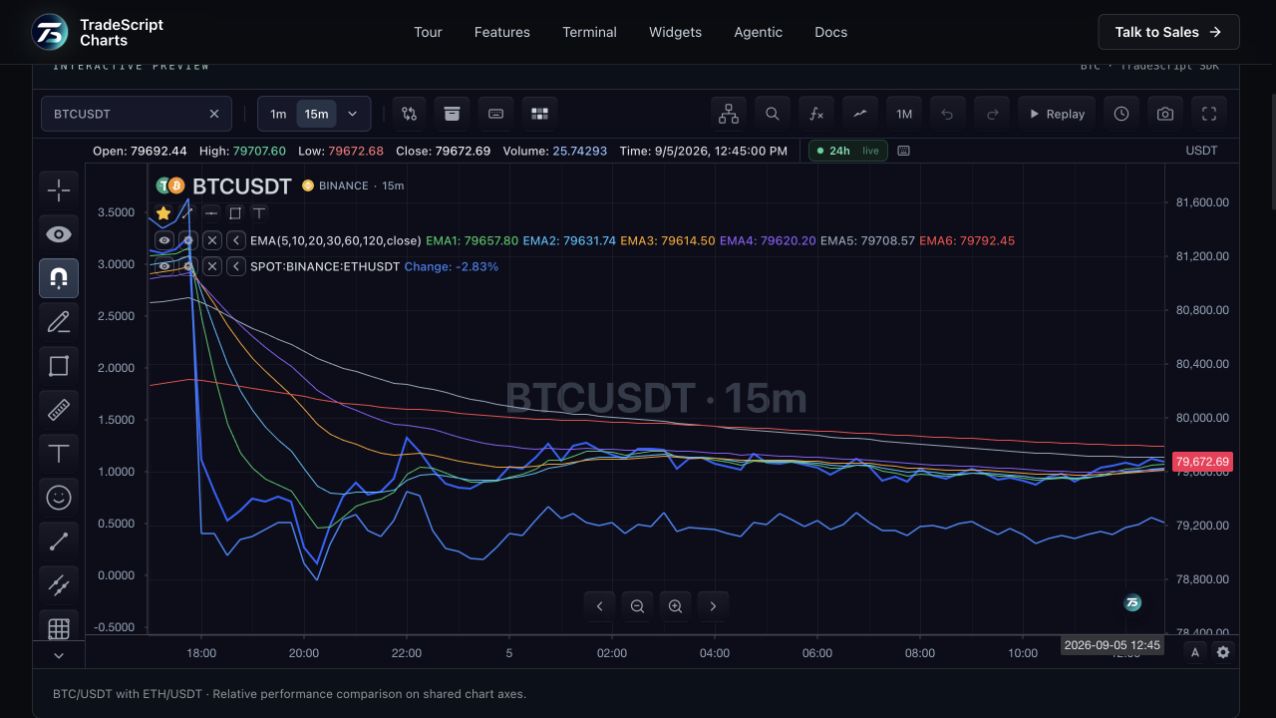
Percentage comparison helps inspect relative movement between instruments whose absolute prices are very different. The result depends on the selected range and reference point, so the view should be read as a comparison of that window.
02
Keep each source explicit
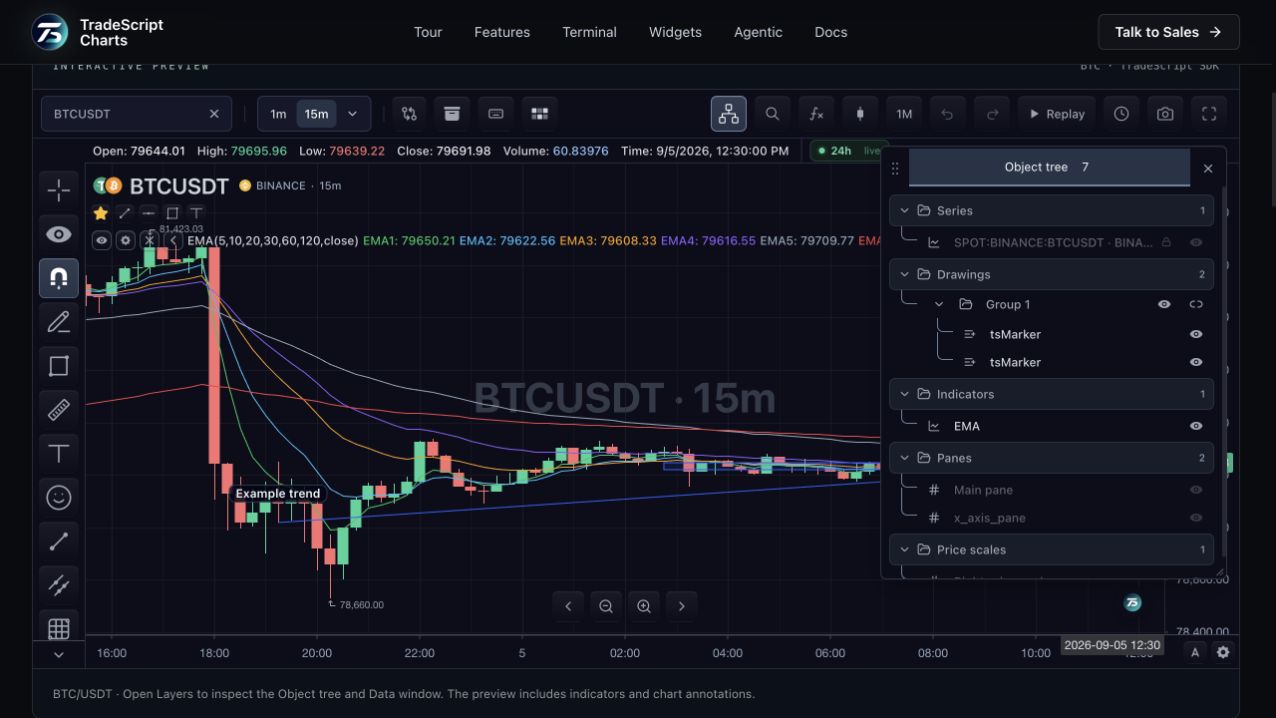
The comparison feed resolves and loads each symbol independently. A chart can only compare the instruments and historical ranges its feed supplies. The series retains its identity for its legend and management controls.
03
Move through a shared timeline
Pan and zoom the main chart while inspecting the comparison overlay. Use the legend or Object Tree to manage the additional series and remove it when the comparison is no longer needed.
How to use symbol comparisons
- Inspect BTC and ETH across the same time window.
- Pan or zoom to change the comparison range.
- Use the comparison controls to manage the additional symbol.
Data behind this view
Requires historical and optional live data for every selected symbol. Instrument calendars and available ranges can differ.
Common questions
Can symbols have different prices?
Yes. A percentage view supports relative comparisons between instruments with different absolute prices.
Can I compare across exchanges?
The chart supports independently resolved symbols; the connected datafeed must supply each requested market.