Comparisons
Comparisons are first-class chart data series. They are stored in chart state, layout state, templates, and workspace state, and they use the same datafeed contract as the primary chart symbol.
The resulting chart is multi-series: the primary symbol keeps its chart type and scale, and each comparison renders as an additional line with its own color and symbol tag at the series endpoint. On a shared percent scale all series start from a common baseline so relative performance reads directly; on a new price scale or new pane the comparison keeps raw prices with its own axis. The legend and the Compare dialog list every active comparison.
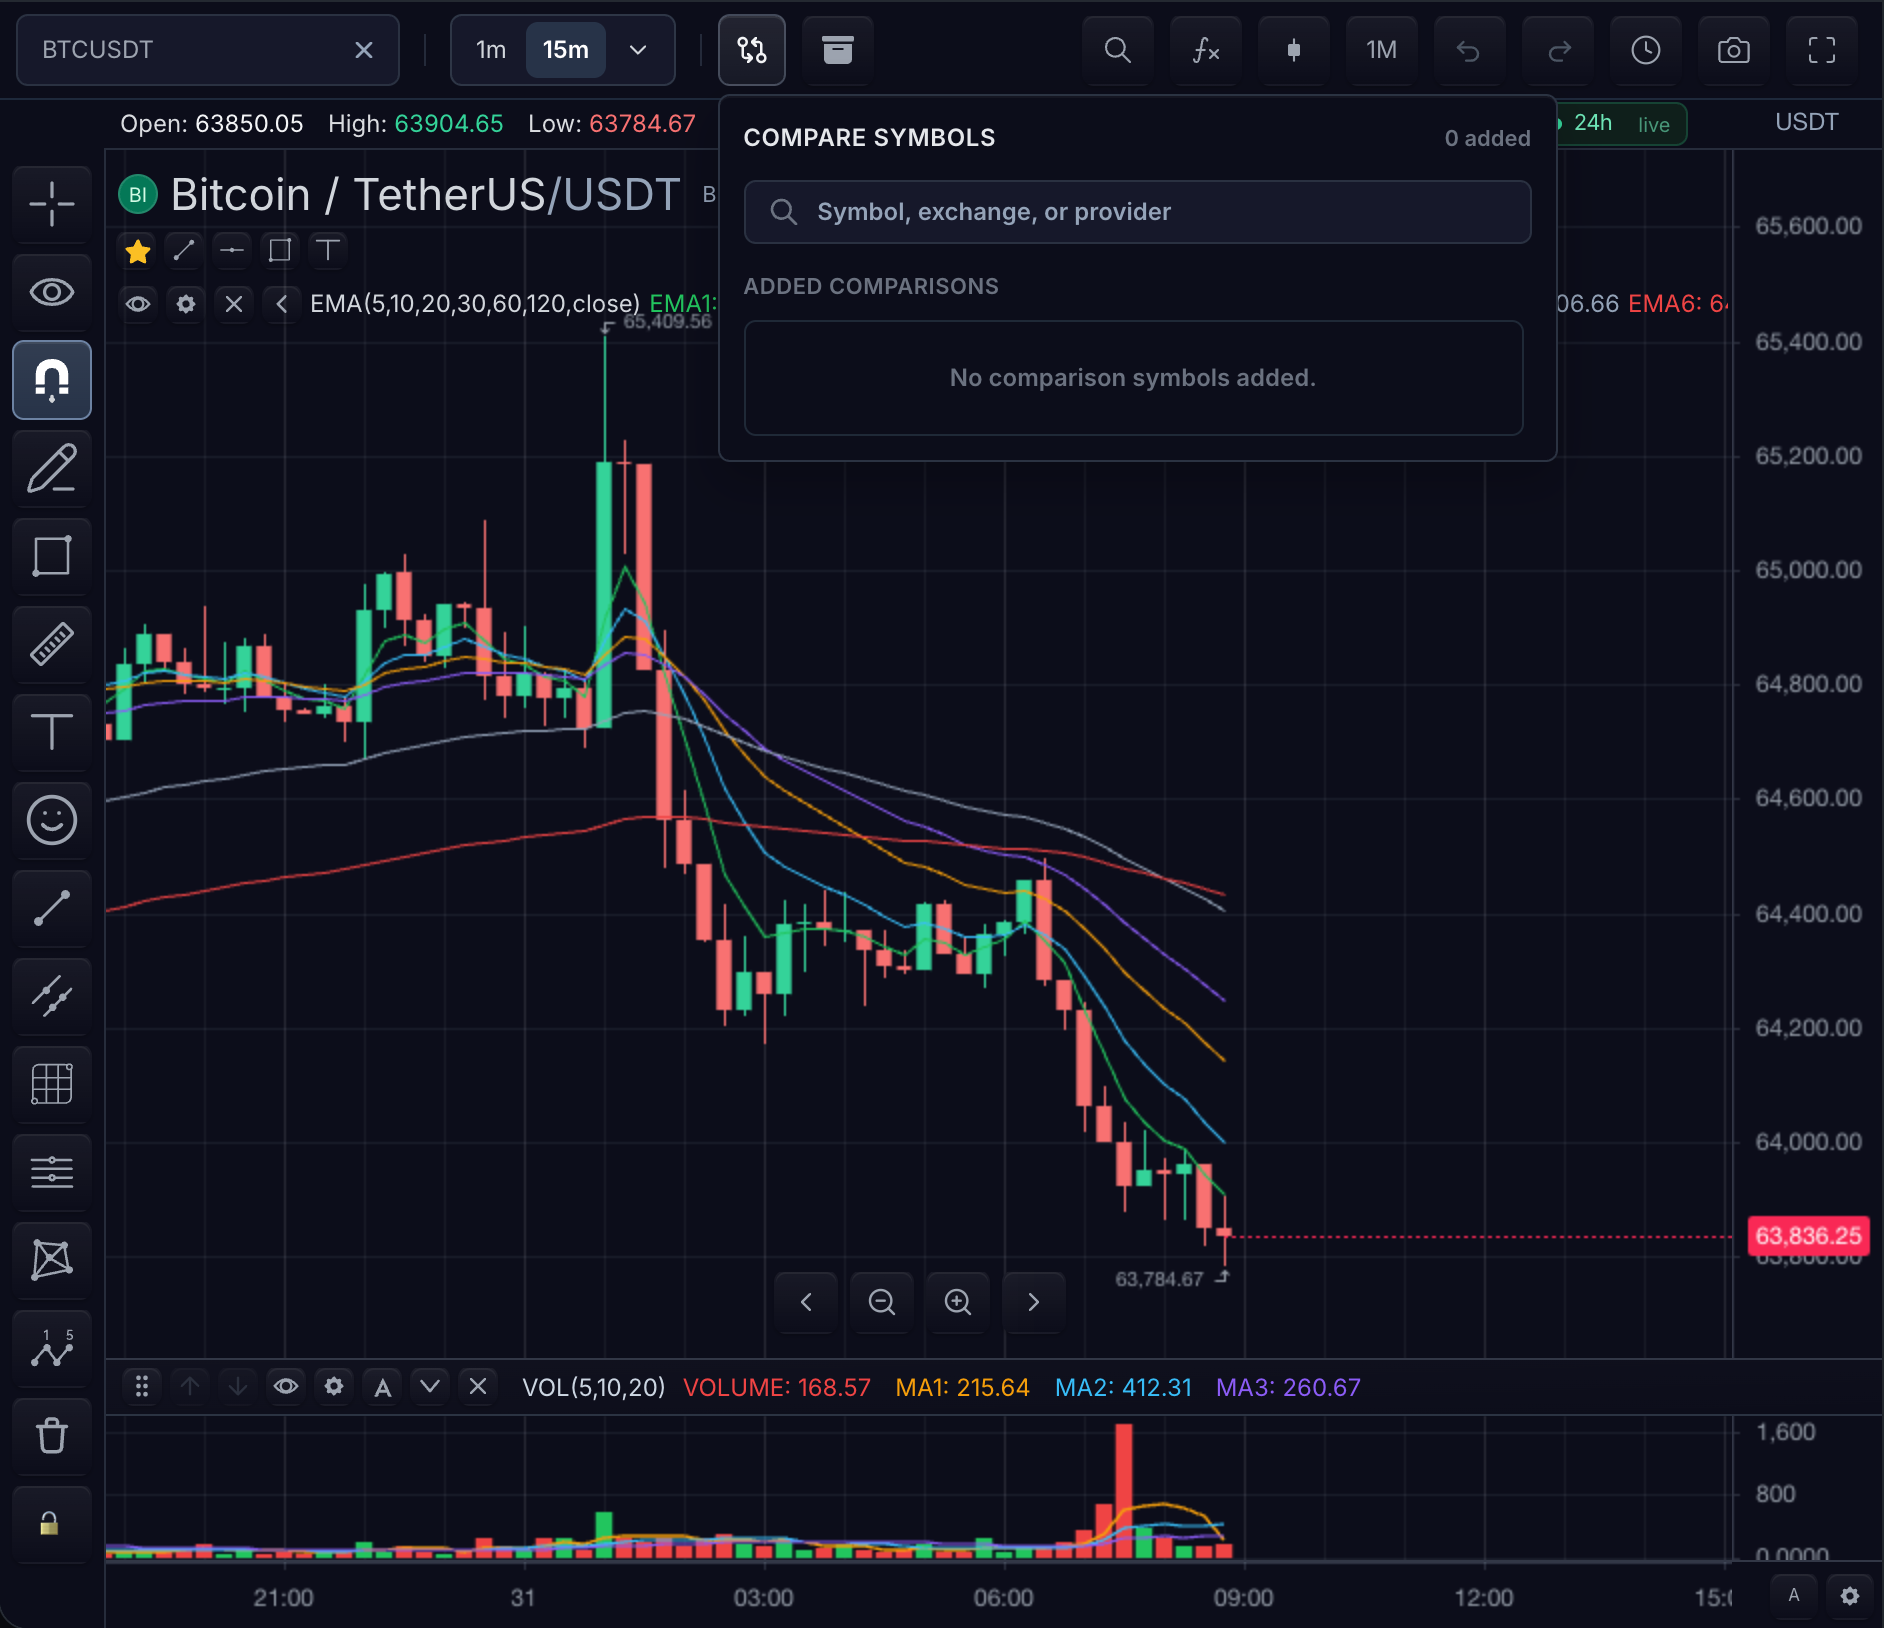 The Compare dialog. Quick-add entries come from
 features.comparisons.recentSymbols; search rows use datafeed.searchSymbols. Both paths call the same addComparison controller method.
Add and remove
const id = await chart.addComparison({
  symbol: 'SPOT:BINANCE:SOLUSDT',
  scaleMode: 'same-percent-scale',
  baseline: 'first-visible',
  color: '#3b82f6',
})

const comparisons = chart.getComparisons()
const bars = chart.getComparisonBars(id)

await chart.removeComparison(id)
addComparison resolves the symbol through the datafeed, loads its bars for
the chart's interval, and returns the stable comparison id used by every later
call. getComparisons() returns the current series list; setComparisons(...)
replaces the whole list atomically. The comparison-change chart event fires
on every add, update, removal, and bar-data update.
Testable behavior:
- Symbol identity: each comparison keeps its resolved
SdkSymbolInfo. Adding the same symbol string twice creates two series with distinct ids; identity for updates and removals is the returned id, never the ticker. - Unavailable data: when the datafeed cannot serve the symbol for the current interval, the comparison surfaces the datafeed error and does not render bars; the primary series is unaffected. Removing the failed comparison restores the previous chart state.
- Removal: after
removeComparison(id), the series leaves the canvas, the legend,getComparisons(), and serialized chart state. Comparison scales or panes created for it are released.
Style
await chart.updateComparison(id, {
  color: '#f59e0b',
  lineStyle: 'dashed', // 'solid' | 'dashed' | 'step'
  lineWidth: 2,
  visible: true,
})
Style patches keep the comparison id and its loaded bars; only rendering
changes. visible: false hides the series without removing its state.
Scale
await chart.updateComparison(id, { scaleMode: 'new-price-scale' })
same-price-scale: raw comparison prices on the main pane's existing scale.same-percent-scale: normalizes the comparison by its baseline and renders percent change on the main pane.new-price-scale: raw comparison price on the main pane with an independent comparison scale identity.new-pane: raw comparison price in a separate comparison pane layer.
Supported baselines for percent normalization are first-visible,
first-loaded, session-open, custom-time (with baselineTime), and
custom-value (with baselineValue).
Search and the Compare dialog
Seed the Compare dialog with host-curated symbols through
features.comparisons.recentSymbols. These render as quick-add targets and
use the same addComparison controller path as search results.
sdk.chart.mount({
  mount: '#chart',
  symbol: 'AAPL',
  interval: '1D',
  datafeed,
  features: {
    comparisons: {
      search: true,
      maxComparisons: 6,
      scaleModes: ['same-percent-scale', 'new-price-scale', 'new-pane'],
      recentSymbols: [
        { ticker: 'MSFT', name: 'Microsoft', exchange: 'NASDAQ', type: 'stock' },
        { ticker: 'SPX', name: 'S&P 500 Index', exchange: 'SPCFD', type: 'index' },
      ],
    },
  },
})
Limits and feature policy
features.comparisons controls the built-in UI surface:
enabled— turn the comparison feature off entirely.search— allow adding comparisons through symbol search.maxComparisons— cap the number of concurrent comparison series; the dialog disables adding beyond the cap while API callers receive a validation error.scaleModes— restrict which scale modes the dialog offers.showSymbolLabels— compact symbol tags at comparison overlay endpoints (default on).extendTimeScale— allow comparison bars after the primary series tail to extend the chart time scale.
Datafeed metadata
Historical and realtime comparison requests include metadata so hosts and backends can route multiple subscriptions correctly:
{
  chartId,
  layoutId,
  comparisonId,
  role: 'comparison'
}
The SDK passes the existing RealTimeBarSubscription.transport through
unchanged. A backend can implement one multiplexed websocket or many
per-symbol websocket subscriptions behind the same subscribeRealTimeBars
API.
Host-provided data
Advanced integrations can bypass MarketDataFeed for a comparison while
keeping the same chart state and UI:
await chart.addComparison({
  symbol: { ticker: 'CUSTOM:SPREAD' },
  scaleMode: 'same-percent-scale',
  baseline: 'first-loaded',
  data: {
    bars,
    realtime(subscription, callback) {
      return subscribeToCustomSpread(subscription, callback)
    },
  },
})
Host-provided data is runtime-only and is not serialized into layout or
template state.
Multi-chart sync
Comparison sync is separate from symbol sync:
workspace.setSyncSettings({
  symbol: false,
  comparisons: true,
})
When enabled, add, update, remove, and set operations synchronize the full comparison list across visible layout panes. Turning comparison sync off leaves each chart pane with its own comparison list.
Next steps
- Symbol Search — the datafeed contract behind the Compare dialog.
- Price Scale — the scale modes comparison series resolve to.
- Build a Multi-Chart Workspace — separate charts as an alternative to overlaying series.