01
Compare price presentations
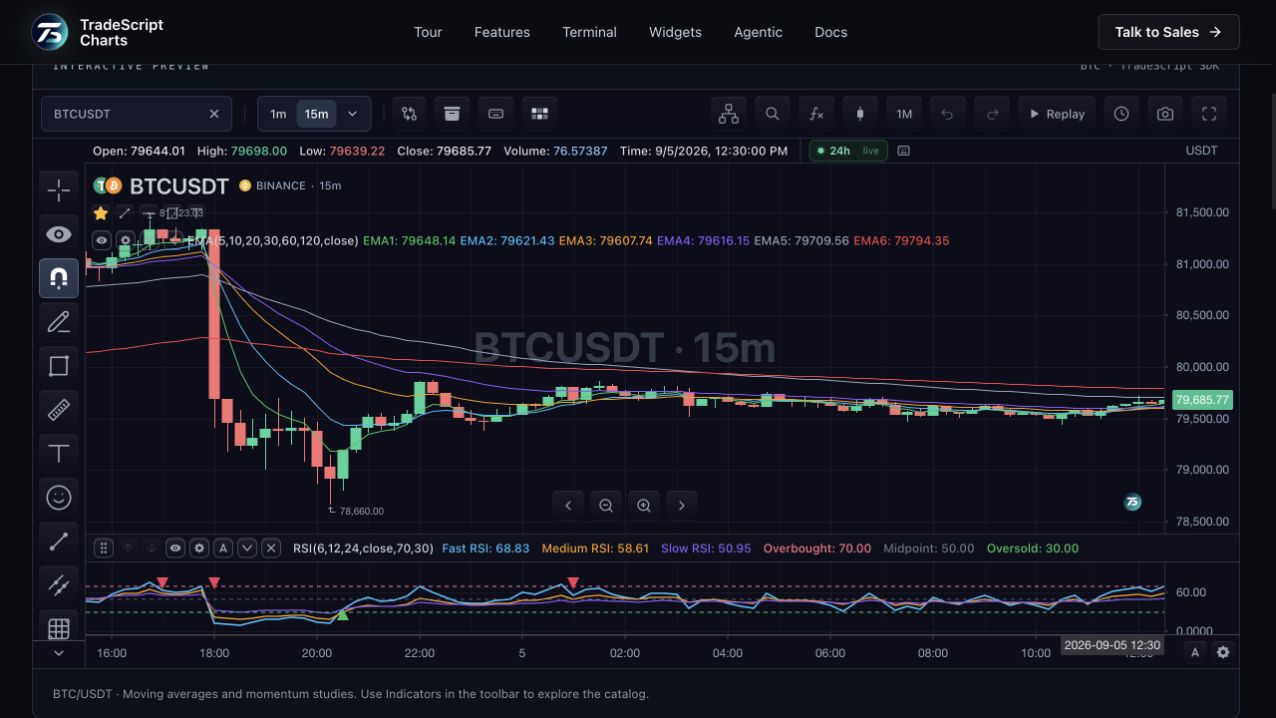
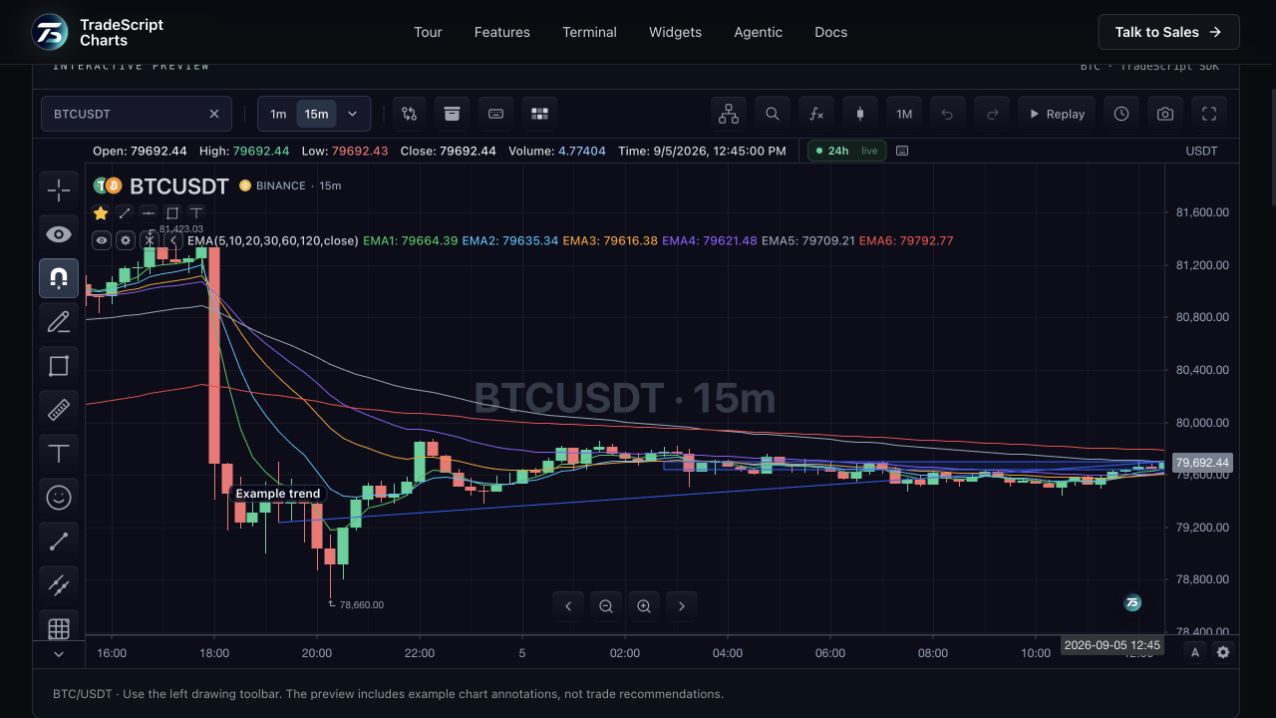
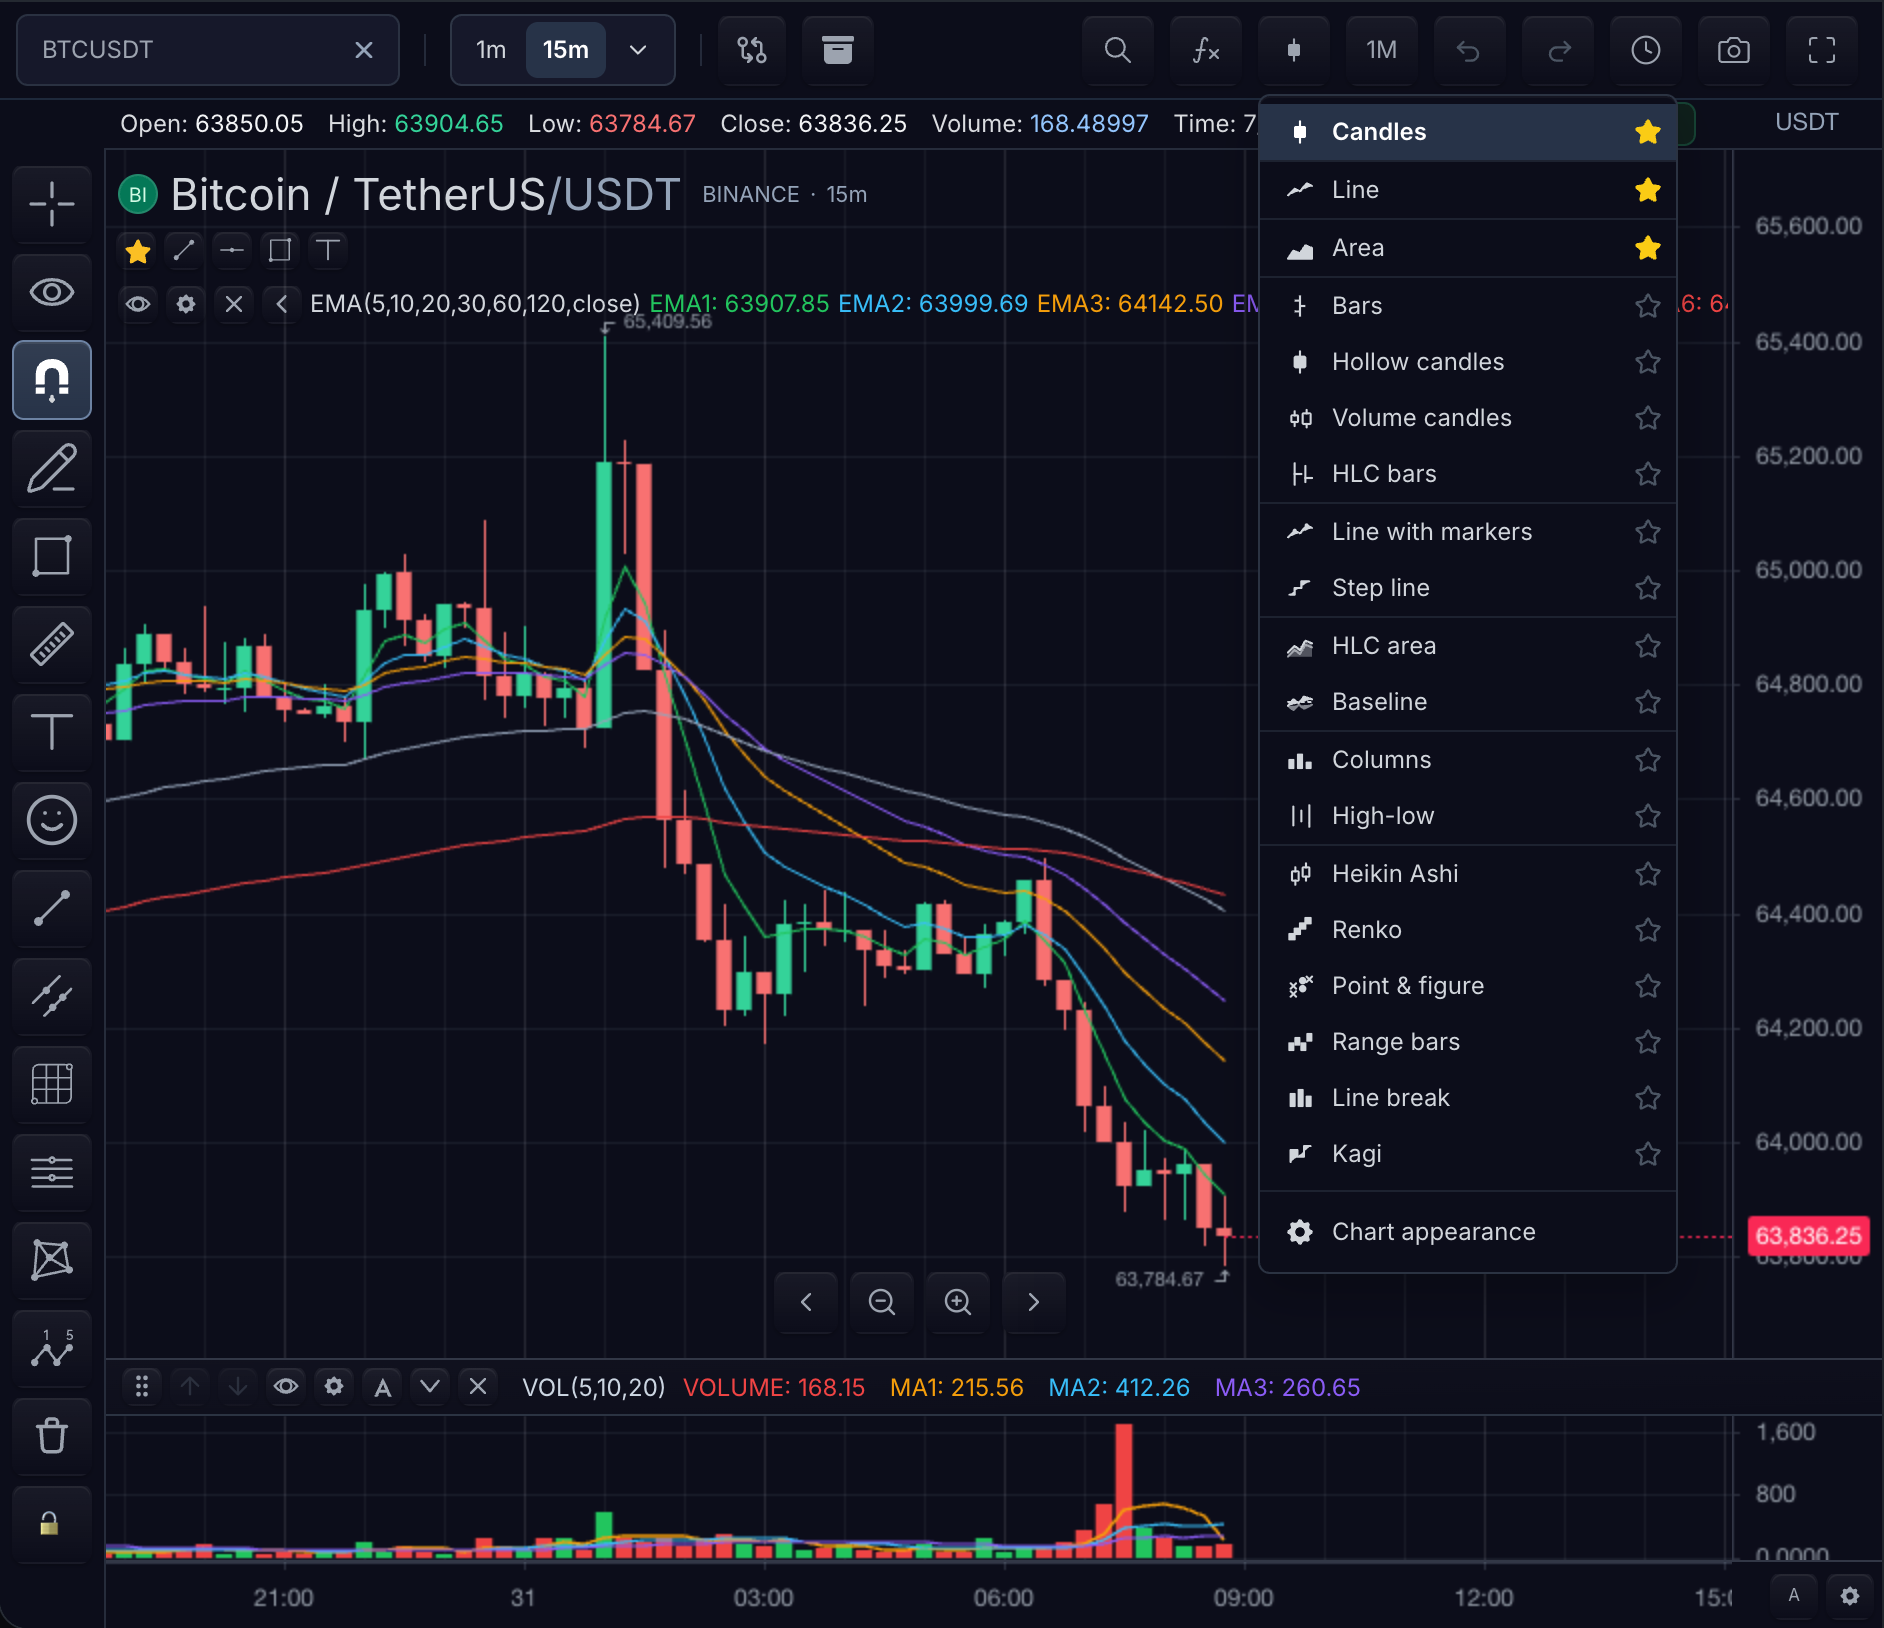
Candlesticks and OHLC bars expose open, high, low and close. Line and area styles emphasize the price path, while hollow candles and other styles change how individual bars are presented. The selected style does not change the instrument behind the series.
02
Use the chart-type control
The chart toolbar exposes the configured styles. A host can also set the type through its chart integration. Chart interval and type are separate settings, so changing presentation does not imply a different sampling interval.
03
Respect specialized data requirements
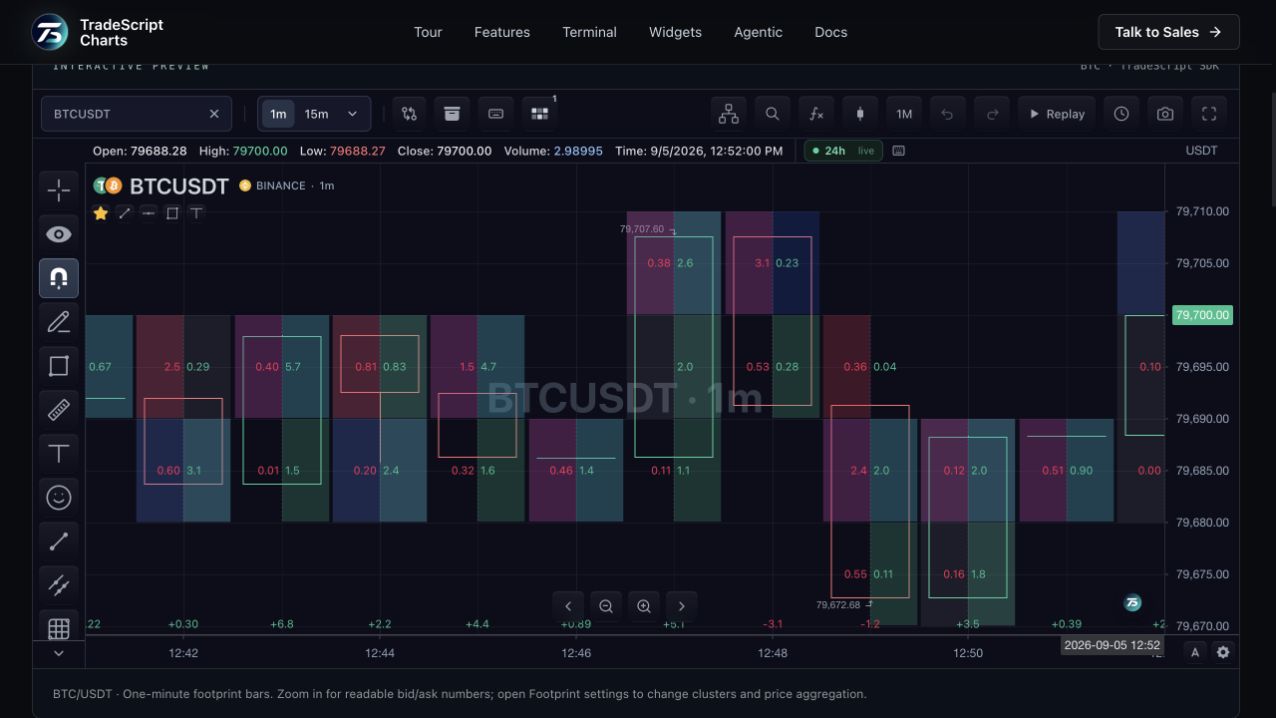
Footprint needs classified execution data in addition to ordinary bars. Market profiles and order-flow overlays have their own inputs and controls. A menu entry alone does not guarantee that the connected feed supplies every required field.
How to use chart types
- Open the chart-style gallery.
- Compare candles, line and area presentations.
- Use the chart-type selector on a chart to inspect the available choices.
- Visit the footprint guide for execution-volume requirements.
Data behind this view
Basic chart styles require historical bars. Specialized styles and overlays require their documented data inputs.
Common questions
Does changing chart type change the symbol?
No. Chart type controls presentation; symbol and interval remain separate chart settings.
Can every chart type use OHLCV alone?
No. Footprint and other specialized views require additional source data.