01
Choose the data range
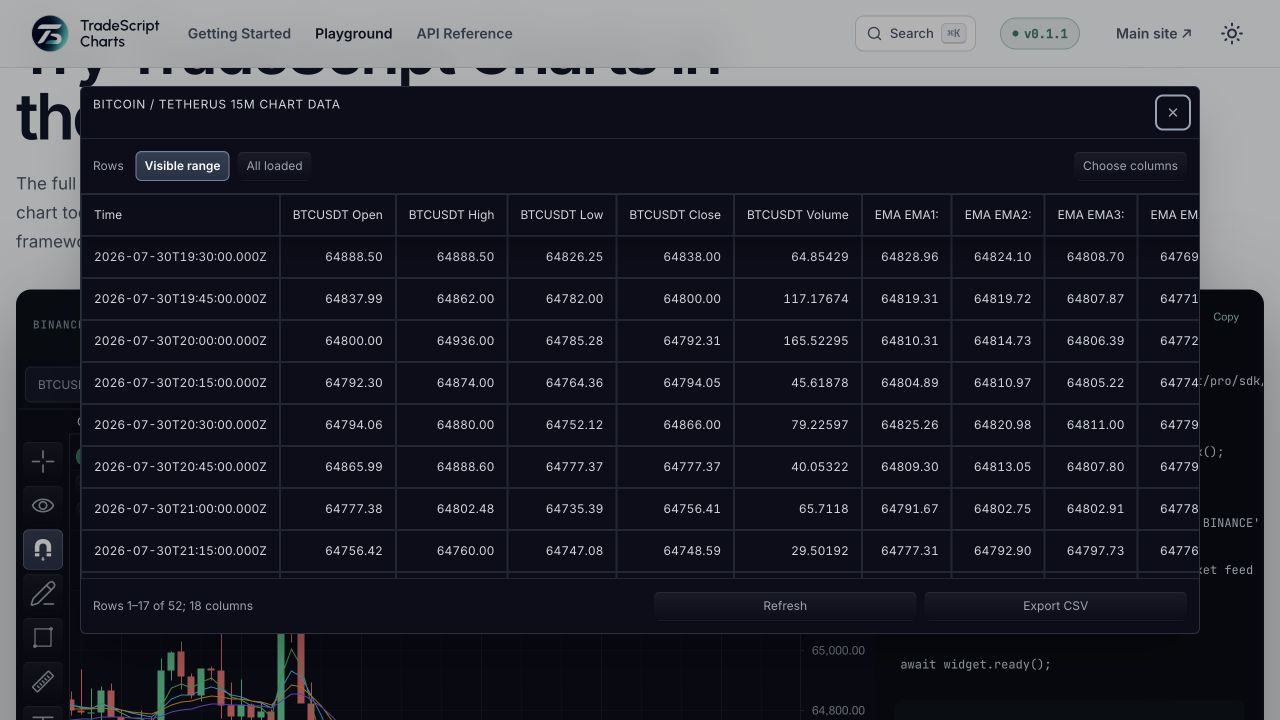
The table can follow the visible range or inspect loaded chart history. Its rows come from the chart API and therefore reflect the bars the chart actually has available.
02
Select the fields you need
Column controls organize chart and indicator fields. Virtual rows and keyboard navigation support inspecting a larger dataset without requiring every row to be visible at once.
03
Keep exports attributable
An export represents the selected chart data and fields. It cannot include history the feed has not loaded, and its values retain the instrument and interval context of the chart.
How to use chart data table
- Open the chart-and-table demonstration.
- Compare a table row with the chart.
- Change visible-range or loaded-row selection.
- Inspect column selection and available export controls.
Data behind this view
Requires a chart instance with loaded rows. Indicator fields depend on the configured studies.
Common questions
Is the table a separate price feed?
No. It reads the rows and fields exposed by the chart API.
Can it show unloaded history?
No. Load the required history through the chart datafeed first.