Chart Data Table
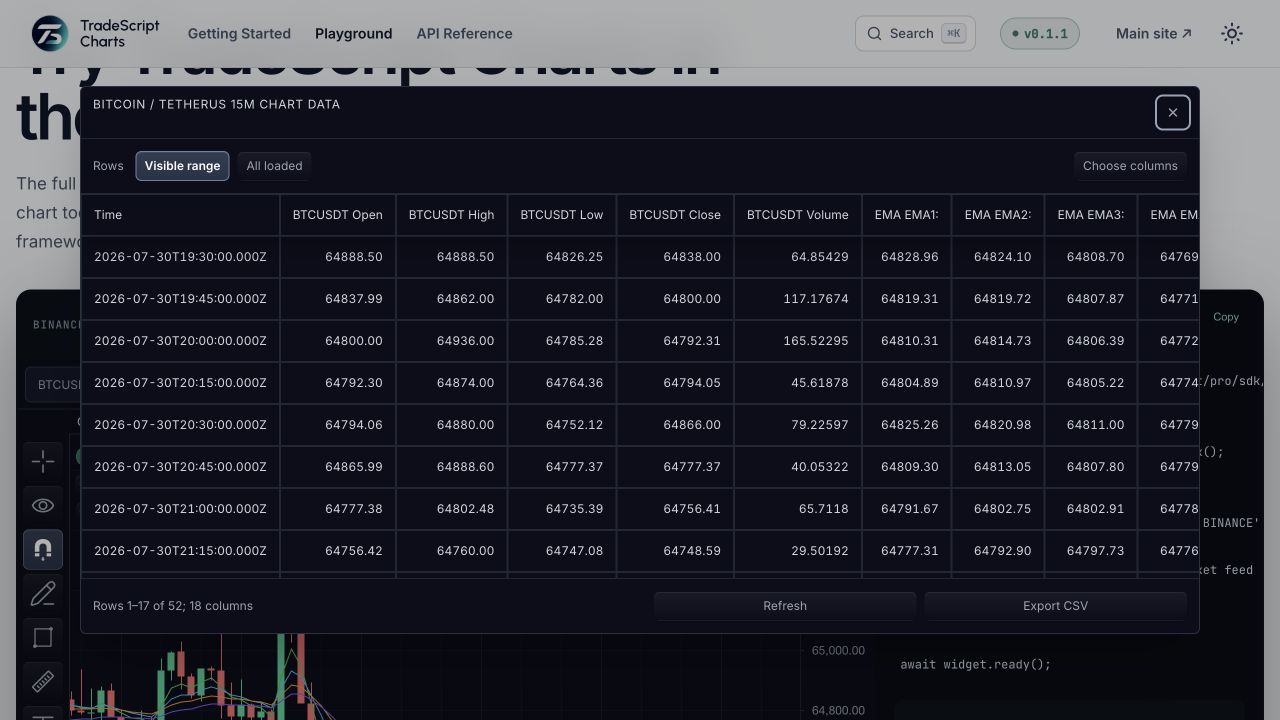
The Chart Data Table is a keyboard-operable dialog that presents the chart's series data as a semantic grid. Users open it with Alt+D, or the accessible data-table action, when accessibility.dataTable is enabled — it defaults to on.
The open dialog reads top to bottom:
- A title naming the symbol, the interval, and "chart data".
- A row-scope control switching between Visible range and All loaded.
- A schema-backed column chooser.
- The data grid: a time column plus the selected value columns.
- Refresh and CSV-export actions.
Large histories render as virtual rows, so scrolling stays responsive.
Minimum configuration
The table needs no datafeed work beyond the bars the chart already has. Enabling the accessibility feature (or leaving it at its default) is sufficient:
sdk.chart.mount({
  mount: '#chart',
  symbol: 'AAPL',
  interval: '1D',
  datafeed,
  accessibility: {
    dataTable: true, // default; Alt+D opens the built-in table
  },
});
User flow and states
- Open with Alt+D or the accessible data-table action.
- Choose Visible range or All loaded.
- Choose columns without changing the underlying chart.
- Move through cells with Arrow, Home/End, Page Up/Page Down, and Enter.
- Export the current scope and selection.
| State | Behavior |
|---|---|
| Empty chart | Headers plus an intentional empty state |
| Refresh error | Stays inside the dialog; column selection is preserved |
| Export error | Stays inside the dialog; column selection is preserved |
| Large history | Virtual rows keep the grid responsive |
Columns and data ownership
The table is driven by ChartApi.exportData(). It therefore uses the same timestamps and sparse-column rules as programmatic exports instead of rebuilding values from rendered labels. It includes:
- main-series OHLCV fields
- every comparison-series OHLCV field
- every indicator plot exposed by the chart
- visible-range and all-loaded row scopes
- schema-backed column selection
- CSV export of the current range and column selection
Host-owned placement
The table is also an exported React component for host-owned placements:
import { ChartDataTableModal } from '@tradescript/pro/react';

<ChartDataTableModal
  open={open}
  onOpenChange={setOpen}
  chart={chart}
  title={`${chart.getSymbol().ticker} ${chart.getInterval()} chart data`}
/>
The built-in table performs a local browser download by default; pass onCsvDownload to ChartDataTableModal when the host owns storage or download policy.
Programmatic CSV
Use chart.exportCsv() when no table UI is required:
const csv = await chart.exportCsv({
  timeRange: chart.getVisibleRange(),
  columnIds: ['time', 'main.close', 'indicator:rsi:rsi'],
  includeBom: true,
});
The method returns the CSV string so the host can download it, upload it, attach it to a support case, or expose it to an agent.
Data Window versus Data Table
The Data Window is a compact, datafeed-owned snapshot at the crosshair. The Chart Data Table is an SDK-owned historical grid backed by exportData(). Use the Data Window for venue-specific point-in-time fields and the Chart Data Table for historical OHLCV, comparisons, indicator plots, and exports.
Related pages
- Data Window — crosshair-scoped values from the datafeed.
- Accessibility — the wider keyboard and screen-reader surface the table belongs to.
- Snapshots — image export rather than tabular export.