Mobile Chart
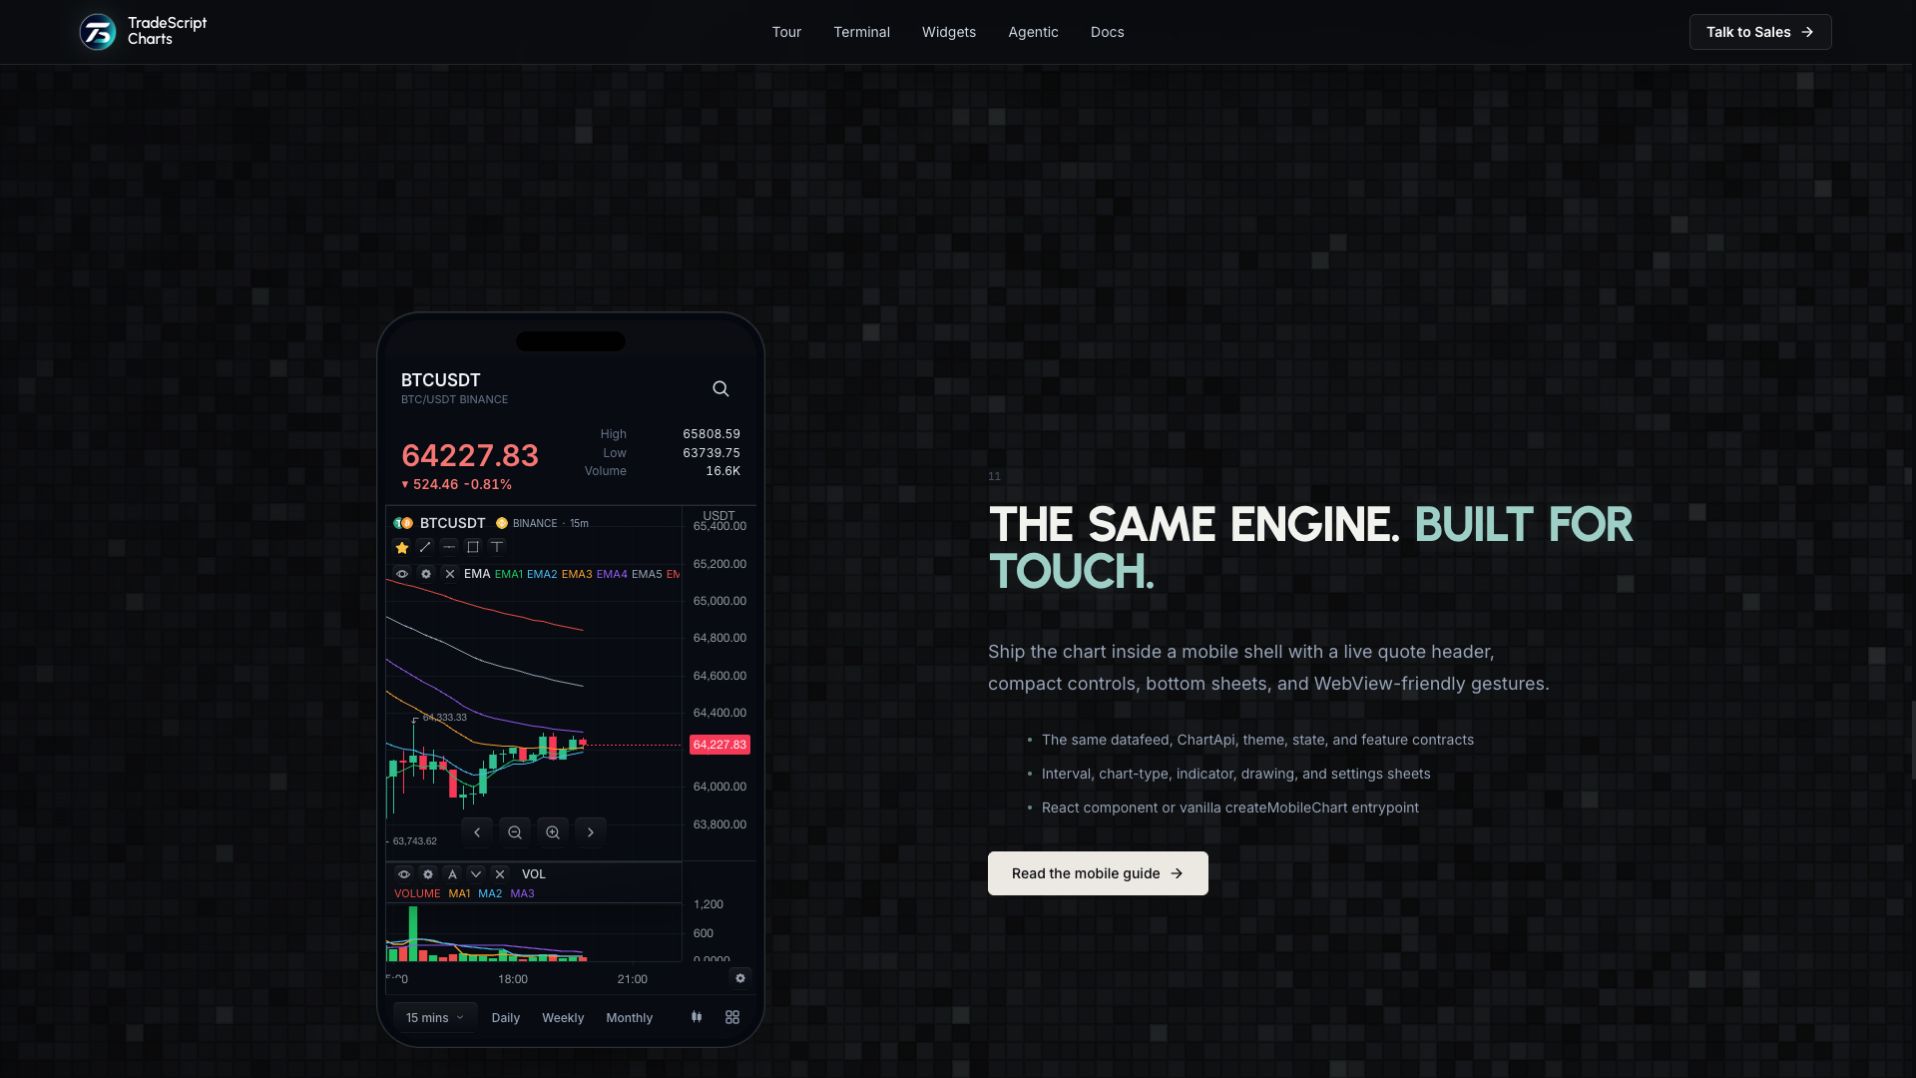
TradeScriptMobileChart is a mobile shell with the same chart capabilities as
TradeScriptWidget. It renders the standard widget and uses the public
ChartApi and MarketDataControllerApi. The shell owns layout, gestures, safe areas, toolbar behavior, performance policy, and the responsive transition between mobile and desktop. Everything below that line is the standard chart.
Layout
The regions in the screenshot are described top to bottom:
- Quote header — symbol name with a search affordance, live price and change, and day High/Low/Volume stats. It replaces the in-chart legend values and OHLCV strip at phone widths.
- Chart — the full-height standard chart widget, edge to edge.
- Sub-bar — a compact row under the chart with the active-interval pill, inline quick intervals, a chart-type button, and a Chart Toolbox button.
- Bottom sheets — everything else lives in rounded sheets that slide over the chart: a grouped Time Interval picker, a Chart Type tile grid, and the toolbox (Indicators, Draw, Settings, optional Trade). At most one sheet is open at a time; a sheet is either closed, or open above the still-visible chart with a backdrop between them.
Breakpoints and states
The shell defines no internal media-query breakpoints: it sizes to its
container (or to the viewport with ?embed=1) and its layout is designed for
phone portrait widths. The states a QA pass should cover are:
| State | What is visible |
|---|---|
| Default | Header, chart, sub-bar; no sheet |
Sheet open (interval, chartType, toolbox, symbol, indicators, drawings, settings) | Chart remains mounted behind the backdrop; one sheet above it |
| Initial sheet | mobile.initialSheet opens one named sheet on mount |
| Trade enabled | Trade tile present in the toolbox (onTradeTap set or showTradeAction: true) |
React usage
import { TradeScriptMobileChart } from '@tradescript/pro/react'

<TradeScriptMobileChart
  symbol={{ ticker: 'SPOT:BINANCE:BTCUSDT' }}
  interval="15m"
  datafeed={datafeed}
  mobile={{
    intervals: ['1m', '5m', '15m', '1H', '1D', '1W', '1M'],
    onTradeTap: ({ chart, symbol, interval }) => {
      openHostOrderTicket(symbol, interval)
    },
  }}
/>
TradeScriptMobileChartProps extends the single-chart
TradeScriptWidgetProps, so every widget option (datafeed, theme, features,
initialState, storage, realtime, broker, …) works unchanged. The mobile
options control only the shell. The shell listens to the chart localization
controller; the quote header's compact volume stat uses the active chart
locale from constructor options, initialState.customization.localization, or
runtime chart.customization().setLocale(...) calls.
| Option | Default | Description |
|---|---|---|
intervals | minutes 1–30, hours 1–4, 1D, 1W, 1M | Time Interval sheet entries, grouped automatically by unit. Canonical ChartInterval values; pass { interval, label } for display-only labels. |
quickIntervals | Daily / Weekly / Monthly | Inline shortcuts shown beside the active-interval pill. |
initialSheet | null | Bottom sheet opened on mount ('symbol' | 'indicators' | 'drawings' | 'settings' | 'toolbox' | 'chartType' | 'interval'). |
showTradeAction | true when onTradeTap is set | Show the Trade tile in the toolbox sheet. |
onTradeTap | — | Host-owned trade CTA callback. Receives { chart, widget, symbol, interval }. |
Vanilla usage
createMobileChart(mount, options) mirrors createChart(...) for hosts
without React. It mounts the mobile shell into a DOM target and returns a
chart API proxy with ready() and destroy():
import { createMobileChart } from '@tradescript/pro/sdk'

const chart = createMobileChart('#chart', {
  symbol: 'SPOT:BINANCE:BTCUSDT',
  interval: '15m',
  datafeed,
})

await chart.ready()
chart.setInterval('1H')
// later
chart.destroy()
Gestures
The shell merges these display-setting defaults before mounting the widget; any key you pass wins over the default:
| Setting | Mobile default | Why |
|---|---|---|
pinchScaleEnabled | true | Pinch zoom stays chart-owned. |
horzTouchDragScrollEnabled | true | Horizontal pan stays chart-owned. |
vertTouchDragScrollEnabled | false | Vertical swipes scroll the page/WebView instead of the chart. |
showPriceAxisActions | false | Desktop price-axis action chrome is hidden. |
While a bottom sheet is open the chart stays mounted and streaming; the sheet backdrop intercepts pointer and touch gestures so the chart cannot be panned underneath.
Touch interaction QA checklist:
- Pinch on the chart zooms the time scale; the page does not zoom.
- Horizontal drag on the chart pans bars; the page does not scroll sideways.
- Vertical swipe on the chart scrolls the page or WebView, not the chart.
- With any sheet open, dragging on the backdrop neither pans nor zooms the chart.
- Tapping the active-interval pill or quick intervals changes the interval without opening a sheet; tapping the sub-bar buttons opens exactly one sheet.
- After closing a sheet, chart gestures work again immediately.
Safe areas
The shell fills its container and does not read device safe-area insets
itself; the host owns them. In a WebView host, wrap the WebView in the
platform safe-area container (SafeAreaView in React Native, and the
equivalent insets on iOS/Android) so the quote header and bottom sheets are
not covered by notches or home indicators. In a plain browser page, standard
env(safe-area-inset-*) padding on the container element serves the same
purpose.
Toolbar behavior
The built-in top toolbar is hidden by default through
initialState.customization.toolbar.visible: false — the shell's header,
sub-bar, and bottom sheets replace it. Pass
initialState: { customization: { toolbar: { visible: true } } } to bring it
back.
Feature defaults the wrapper merges into features:
| Feature | Mobile default |
|---|---|
mobileToolbar | true |
drawings.toolbar | false (drawing tools stay available via the Draw sheet) |
watchlist, details, news, dataWindow | false |
sessionBadge | false (overflows the OHLC row at phone widths) |
chartControls.autoFitButton | false (floating auto-fit 'A' hidden) |
chartControls.paneReorder | false (pane drag / move-up / move-down hidden) |
chartControls.paneLegendValues | false (all indicator legends — main pane and sub-panes — show clean plot names like EMA1 / MA1 instead of truncated param/value strings) |
chartControls.settingsPresentation | 'sheet' (settings open as a bottom sheet inside the chart) |
features.chartControls also exposes settingsButton, paneAutoFit, and
paneCollapse so hosts can decide exactly which on-chart controls a mobile
layout shows. The floating settings gear and the toolbox Settings tile both
open the full built-in settings surface (price display, price axis, drawings,
chart display, session colors, auto-fit scale) — as a bottom sheet on mobile,
as the draggable modal on desktop. Programmatic access:
chart.openSettingsDialog().
The wrapper also defaults initialState.customization.legend to
{ showValues: false, showValuesOnMobile: false, showOhlcRow: false } — the
shell's quote header replaces the in-chart candle-value tooltip and the OHLCV
strip. Pass your own legend customization to bring either back.
Performance
The shell renders exactly one standard chart widget and keeps it mounted for
its whole lifetime: opening and closing sheets never remounts the chart, and
realtime streaming continues behind an open sheet. Interval and chart-type
changes go through the normal ChartApi, so they reuse the existing surface
rather than recreating it. Because the shell adds no second chart instance,
datafeed and rendering performance guidance for the standard widget applies
unchanged.
Responsive transitions
The mobile shell is not a responsive mode of the desktop widget — it is a separate composition of the same chart. The host owns the breakpoint:
- Render
TradeScriptMobileChartat phone widths andTradeScriptWidgetat desktop widths, switching on your own media query or device detection. - Both accept the same options, datafeed, and
initialState, so switching components preserves configuration. Chart runtime state (visible range, active drawings) belongs to the mounted instance; persist it through storage if it must survive the swap. - Inside the shell, the settings surface adapts on its own:
settingsPresentation: 'sheet'on mobile, the draggable modal on desktop.
WebView embedding
Host the mobile chart on a web route and render it in any WebView — iOS
WKWebView, Android WebView, Flutter webview_flutter, React Native
react-native-webview, or a plain iframe. The shell's gesture defaults are
built for exactly this host: vertical swipes pass through to the WebView while
horizontal pan and pinch zoom stay on the chart.
As a worked example, in React Native:
import React from 'react'
import { SafeAreaView } from 'react-native'
import { WebView } from 'react-native-webview'

export function ChartScreen(): JSX.Element {
  return (
    <SafeAreaView style={{ flex: 1, backgroundColor: '#000' }}>
      <WebView
        source={{ uri: 'https://your-host.example/chart-sdk-mobile-demo?embed=1' }}
        javaScriptEnabled
        domStorageEnabled
        allowsInlineMediaPlayback
        setBuiltInZoomControls={false}
        overScrollMode="never"
        style={{ flex: 1, backgroundColor: '#000' }}
      />
    </SafeAreaView>
  )
}
The ?embed=1 query renders only the mobile chart surface — no page chrome,
no phone frame — sized to the viewport. The same URL works unchanged in any
other WebView host.
For a hosted device showcase (for example an Appetize iframe), point the emulated app's WebView at the same embed URL.
Next steps
- TradeScript Widget — the desktop chart surface this shell wraps.
- Toolbars — the mobile toolbar gate and its desktop counterpart.
- Accessibility — touch-target, focus, and motion behavior.