Time Scale
The time scale is the horizontal axis under the panes: date/time labels, viewport navigation, and the realtime right edge. Everything about the visible window is programmable: its range in bars or timestamps, how it scrolls and zooms, how labels are formatted, what happens across a data gap, and where a new bar leaves the viewport.
Common interactions
| Task | API or gesture | Visible result |
|---|---|---|
| Zoom around a point | Wheel/pinch or zoomAtTime | Bar spacing changes around the selected anchor |
| Scroll history | Drag/trackpad or scrollToTime | Visible range moves while data identity stays unchanged |
| Return to realtime | Realtime control or scrollToRealTime | Latest bar returns to the configured right margin |
| Apply preset | setTimeFrame(idOrDefinition) | Range and interval adopt the preset definition |
| Reset after resize | Resize with configured range policy | Range stays locked or refits according to settings |
Anatomy

BTCUSDT · 15m · dark theme — bottom time scale captured from the live playground.
Three elements make up the axis strip:
- Time labels — hour labels (
21:00,03:00,06:00, …) formatted throughLocalizationSettings.formatters.timein the active chart timezone. - Day boundary — the
31label marks the date change, formatted throughLocalizationSettings.formatters.date. - The strip is shared by all stacked panes; navigation changes the visible range, it does not rewrite bar timestamps.
Navigation
| Need | TradeScript surface |
|---|---|
| Scroll | scrollToTime, scrollToBar, scrollToRealTime |
| Zoom | zoomAtTime, zoomAtBar, zoomAtCoordinate |
| Mouse-wheel zoom anchor | initialState.displaySettings.timeScaleMouseWheelZoomAnchor selects pointer or right-edge anchoring |
Visible range
| Need | TradeScript surface |
|---|---|
| Visible time range | setVisibleRange, getVisibleRange |
| Visible bar range | getVisibleBarRange |
| Minimum bar spacing | initialState.displaySettings.timeScaleMinBarSpacing |
| Maximum bar spacing | initialState.displaySettings.timeScaleMaxBarSpacing |
| Left edge lock | initialState.displaySettings.timeScaleFixLeftEdge |
| Resize visible-range lock | initialState.displaySettings.timeScaleLockVisibleTimeRangeOnResize |
| Right-margin unit | initialState.displaySettings.timeScaleRightOffsetUnit selects 'percent' or 'px'. The native Settings dialog exposes both units. |
| Percentage right margin | initialState.displaySettings.timeScaleRightOffsetPercent. The native default is 25, so the latest bar lands at 75% from the left after an interval change. |
| Pixel right margin | initialState.displaySettings.timeScaleRightOffsetPx |
| Preserve range while editing | initialState.displaySettings.timeScaleLockVisibleRangeOnRightOffsetChange |
Realtime
| Need | TradeScript surface |
|---|---|
| Return to realtime | scrollToRealTime — the latest bar returns to the configured right margin |
| New-bar viewport policy | initialState.displaySettings.timeScaleShiftVisibleRangeOnNewBar |
| Right-side margin | initialState.displaySettings.timeScaleRightOffsetPercent / timeScaleRightOffsetPx, or chart.setDisplaySettings(...) at runtime |
Latest-bar position after interval changes
Interval changes replace the previous bars, indicator results, grid, and time-scale state as one committed chart frame. They do not reuse a historical right-edge anchor from the previous interval. The latest bar returns to the configured right margin on every transition, including lower-to-higher and higher-to-lower changes.
The built-in default is a 25% right margin, which places the latest bar at 75% of the drawable chart width from the left. The same setting is available under Settings → Time Scale → Right margin and is persisted as part of ChartDisplaySettings in saved chart layouts.
Set the SDK default during construction:
const mounted = sdk.chart.mount({
  mount: '#chart',
  initialState: {
    displaySettings: {
      timeScaleRightOffsetUnit: 'percent',
      timeScaleRightOffsetPercent: 25,
    },
  },
})
const chart = (await mounted.ready()).chart()
Or change it at runtime:
chart.setDisplaySettings({
  timeScaleRightOffsetUnit: 'percent',
  timeScaleRightOffsetPercent: 15,
})
A 15% right margin places the latest bar at approximately 85% from the left. Pixel mode is also supported:
chart.setDisplaySettings({
  timeScaleRightOffsetUnit: 'px',
  timeScaleRightOffsetPx: 120,
})
Labels, gaps, and formatting
| Need | TradeScript surface |
|---|---|
| Time formatting | LocalizationSettings.formatters.date and formatters.time |
| Inactivity gaps | initialState.displaySettings.inactivityGapsVisible and chart.getTimeScale().inactivityGaps() / setInactivityGaps() / inactivityGapsChanged(). Visible gaps require generated empty bars (emptyBars) or another explicit time-domain extension from the feed/cache layer. |
Presets and programmatic control
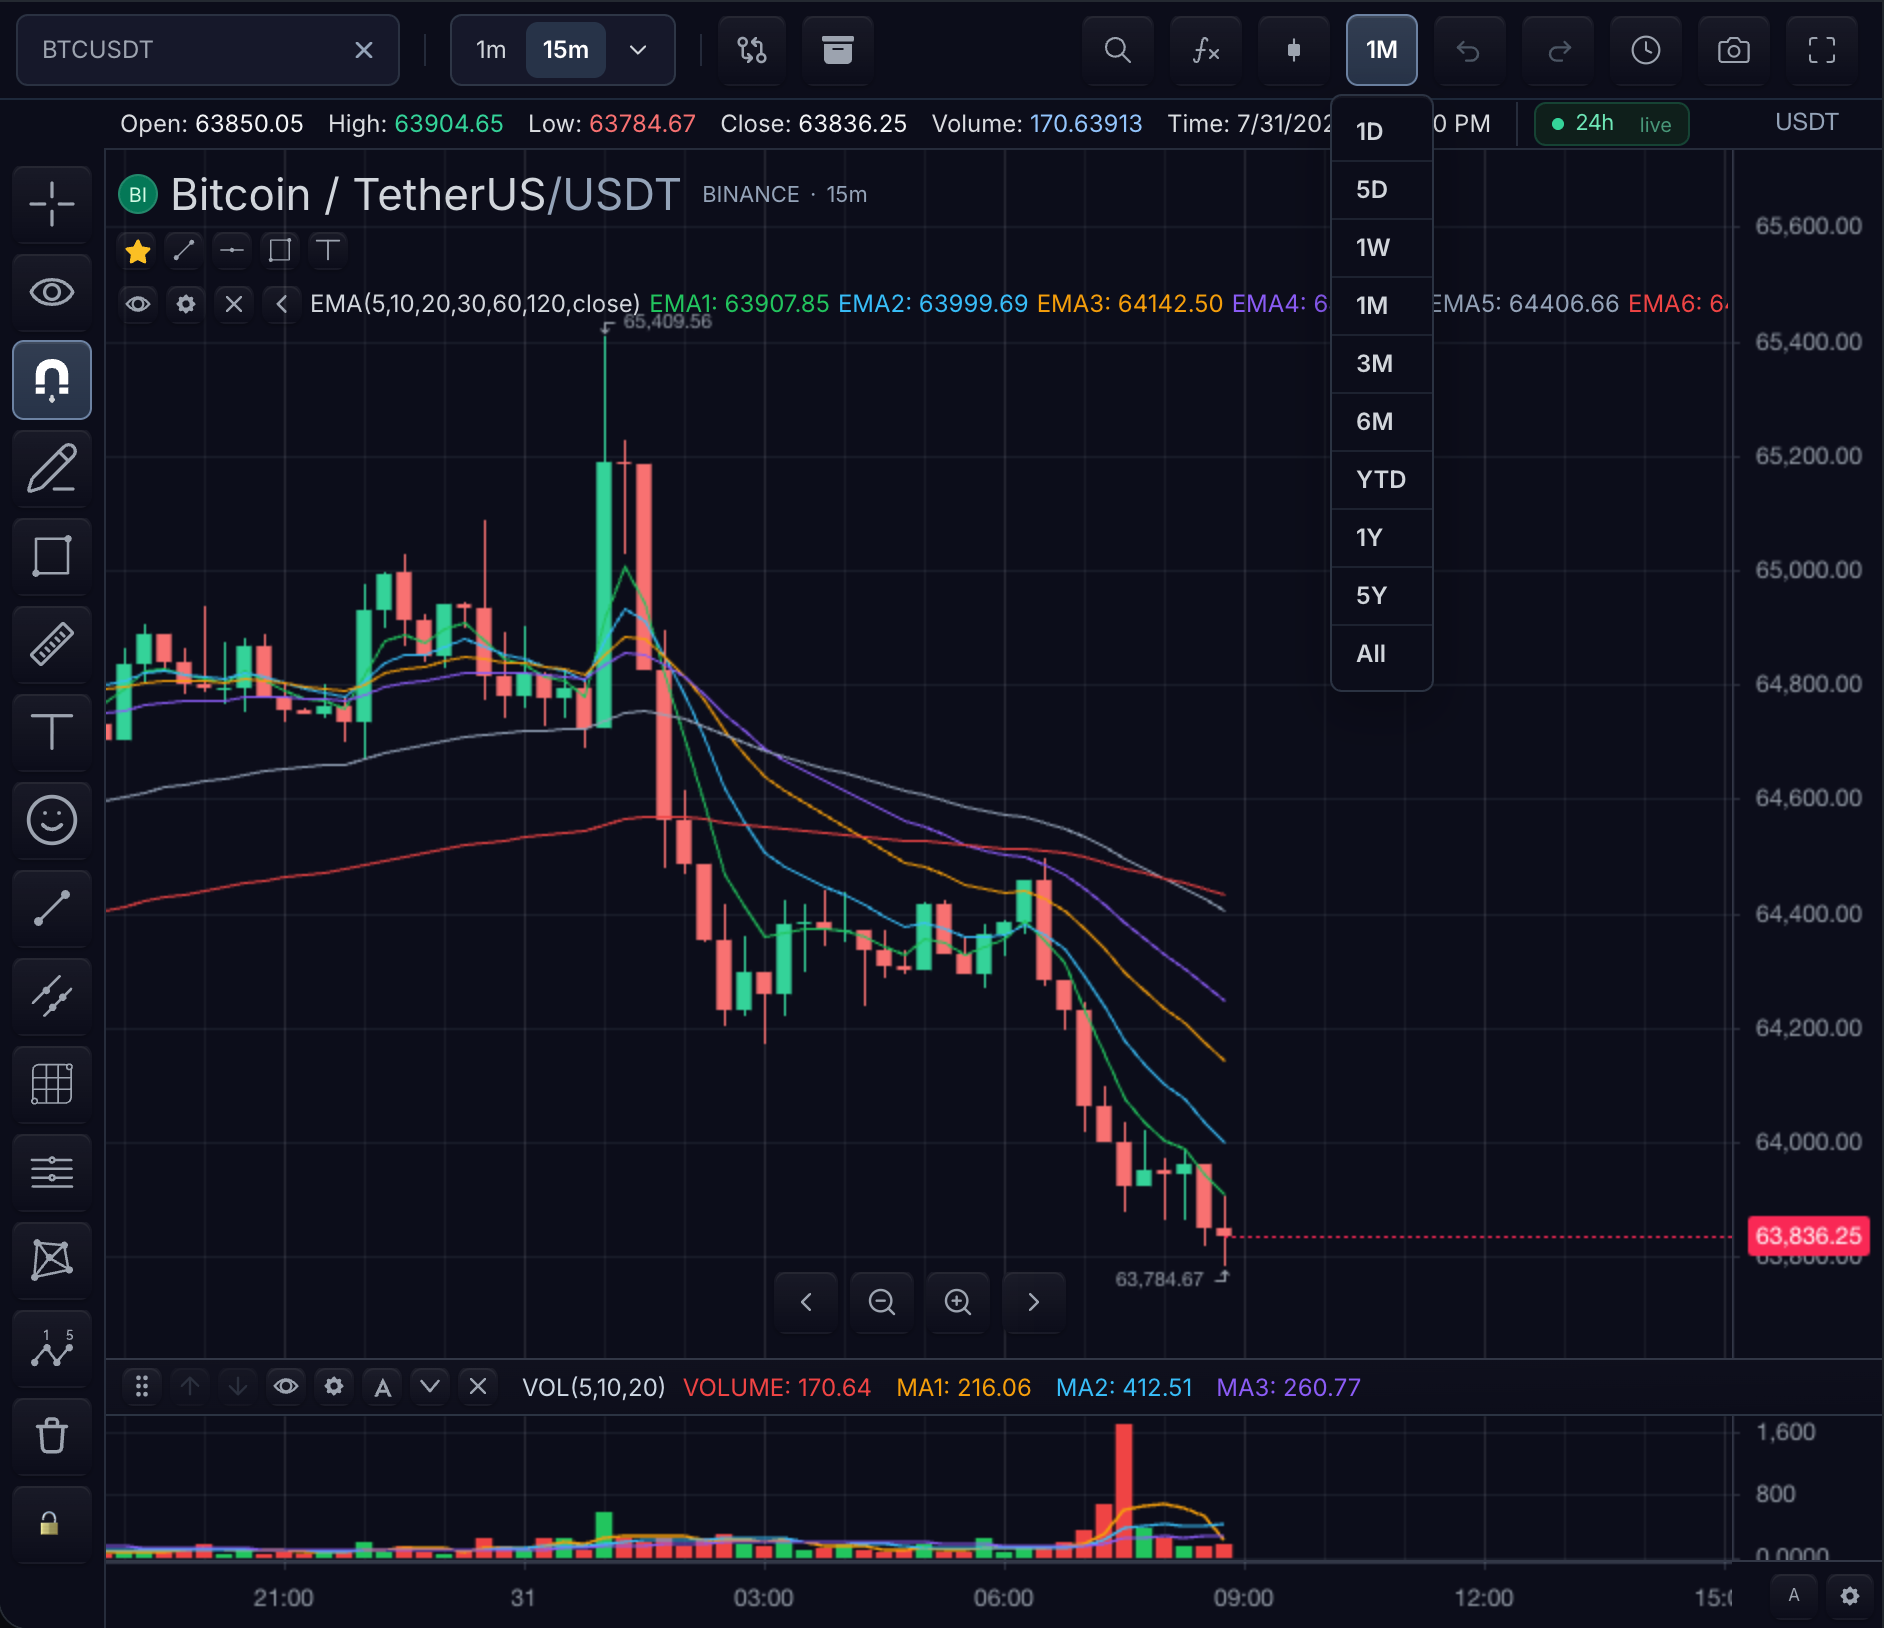
Time range menu open · BTCUSDT · dark theme — presets such as 1D, 1W, 1M, 3M, 6M, YTD, 1Y, 5Y, and All come from ChartWidgetOptions.timeFrames.
| Need | TradeScript surface |
|---|---|
| Time-frame presets | ChartWidgetOptions.timeFrames |
| Apply a preset | chart.setTimeFrame(idOrDefinition) |
Sessions
| Need | TradeScript surface |
|---|---|
| Sessions | sessionSchedule, resolveSessionCalendar, session filtering |
| Extended-session display | createSessionFilterDatafeed(...), features.sessions.modeSelector, and features.sessions.extendedHoursPriceLine |
Extended sessions
Extended-hours display uses the datafeed/session contract. A feed declares session windows through SymbolInfo.sessionSchedule or MarketDataFeed.resolveSessionCalendar; the chart uses those windows for intraday shading, break lines, session-aware aggregation, and filtering.
Use createSessionFilterDatafeed(...) for the regular/extended toggle. The wrapper keeps the full series in the feed/cache layer and filters the presentation:
regularmode keeps only['regular']bars.extendedmode keeps['pre-market', 'regular', 'post-market'].- The chart surface detects the wrapper, shows the Regular Hours / Extended Hours control when
features.sessions.modeSelector !== false, and refetches the visible series in place on session changes. - While regular-only bars are visible,
features.sessions.extendedHoursPriceLine !== falsedraws the live pre/post-market quote as a dashed price line when the feed provides quotes.
See Session Filtering, Session Schedules, and Market Status.
Indicator time extension
Custom indicators can declare canExtendTimeScale, and the public authoring adapter forwards that declaration through indicator.metadata.canExtendTimeScale. The global gate is features.customIndicators.extendTimeScale. When both the global gate and indicator opt-in allow extension, the adapter records right-side extension timestamps from three source-owned places:
- host-supplied secondary-series bars that occur after the primary series tail
- per-plot
PlotStyleOptions.timestamps - explicit
IndicatorRunResult.timeScaleExtensionTimestamps
The Store owns those timestamps as indicator-scoped time-domain slots. Primary OHLC bars are not mutated, indicator inputs stay aligned to loaded main bars, and timestamps at or before the primary tail are ignored.
Indexed plot and marker series remain aligned to loaded bars. Projection plots that need non-primary times should pass timestamps with their value series.
Secondary series time extension
When features.comparisons.extendTimeScale is enabled, loaded comparison bars can contribute right-side timestamps after the primary series tail to the chart's horizontal time domain. The Store owns those extension slots separately from the primary OHLC list, so the main candle series, indicator inputs, high/low ranges, and datafeed cache state are not mutated by placeholder bars.
This covers main-pane comparison rendering, legend values, and comparison panes. The generated comparison-pane indicator uses the same runtime gate and publishes timestamped plot rows for comparison bars after the primary tail, so pane auto-scale and line/candle drawing can render against the extended time domain without synthetic main-series candles.
Use the native flag directly:
sdk.chart.mount({
  mount: '#chart',
  features: {
    comparisons: {
      extendTimeScale: true,
    },
  },
})
Related pages
- Resolution — the interval behind each bar slot
- Timezone Selector — the timezone the labels render in
- Session Filtering and Session Schedules — the session contracts
- Price Scale — the vertical axis