Panes and Scales
Panes are the stacked horizontal regions of the chart — the main candle pane plus separate panes for indicators such as volume or RSI — all sharing one time scale. Price scales are the vertical axis strips each pane's sources resolve to.
Both are addressable. Panes have order, state, and reorder controls; scales have first-class ids, assigned sources, and modes. Every one of those is readable and writable at runtime, which is what lets a host rearrange a workspace without rebuilding the chart.
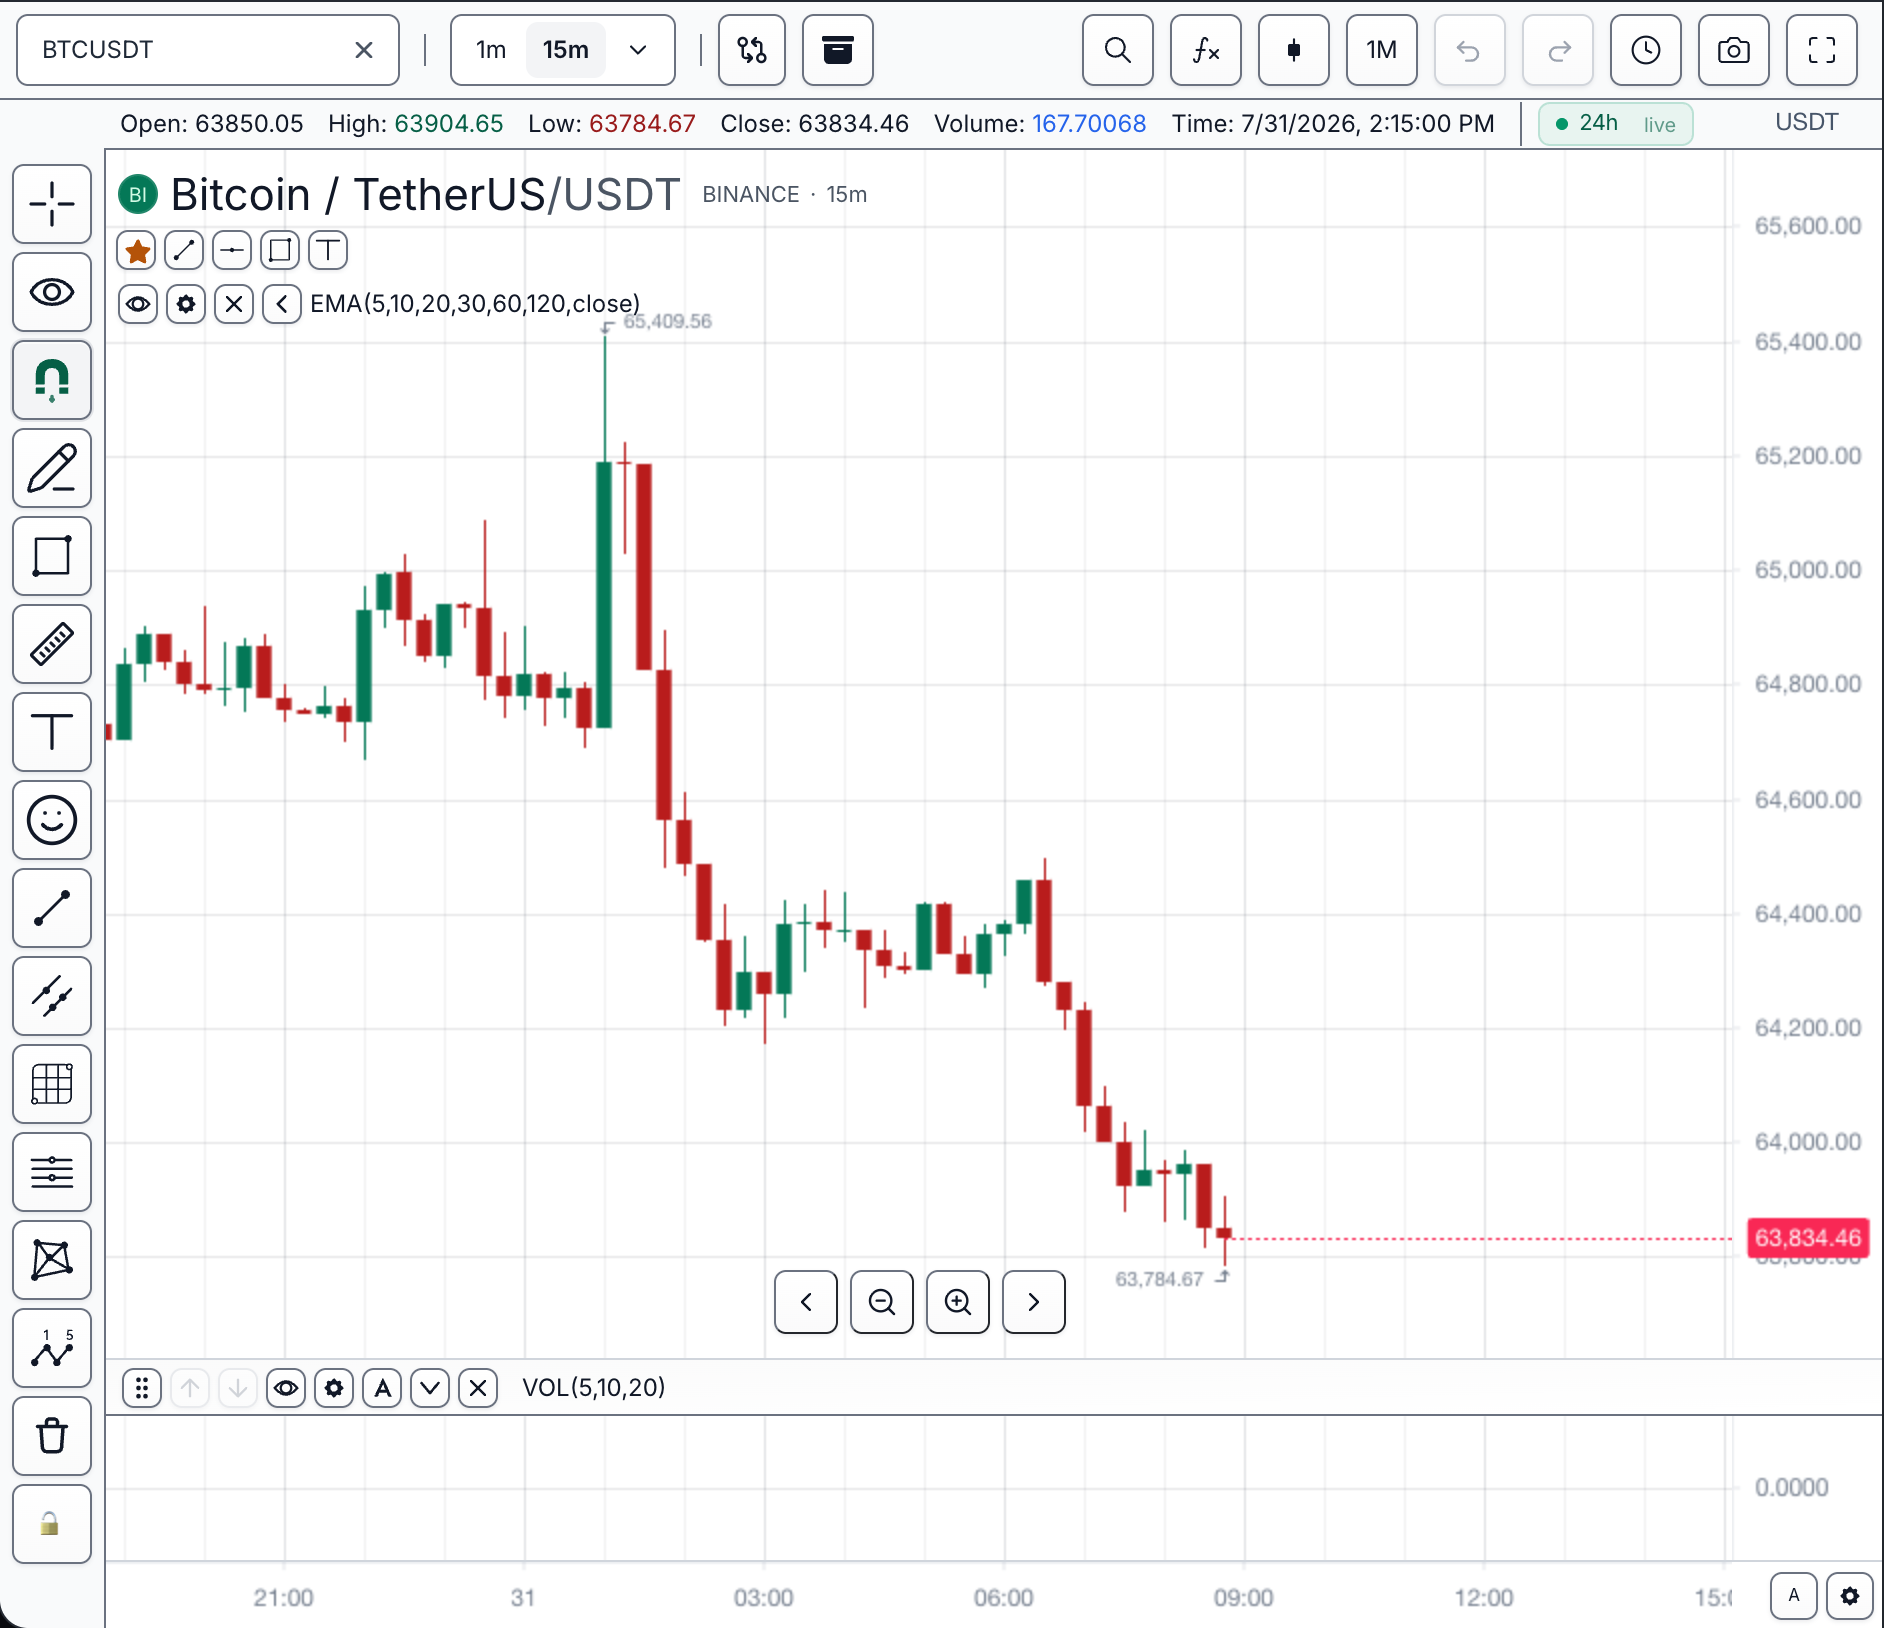
State shown: main candle pane (EMA overlay) above a separate VOL pane, light theme — independent vertical ranges, one shared horizontal time domain.
Pane lifecycle
Pane creation and scale assignment
An indicator declares where it lives (panePlacement: 'main' | 'separate') and which scale it resolves to. Every source follows the same resolution chain, and that chain decides which axis strips exist:
Movement, resize, collapse, and removal
Behavior and persistence ownership
Every row names the visible state and the layer that persists it:
| Action | Visible state | Persistence owner |
|---|---|---|
| Create separate-pane indicator | New pane below the current target | Chart state/layout |
| Assign left/right/overlay scale | Axis strip or overlay transform changes | Indicator/series scale settings |
| Resize | Pane keeps identity while its height changes | Layout state (pane-drag-end with PaneLayoutPayload.panes[]) |
| Collapse / maximize / restore | Pane header remains; content height minimizes, fills, or returns | Layout state (pane-layout-change) |
| Move up/down | Pane order changes; shared time alignment remains | Layout state (setPaneOrder, pane-order-change) |
| Move scale left/right | The axis strip switches sides of its pane | Price-scale settings (setPriceScale(...)) |
| Remove last source | Empty pane is removed unless a retained pane contract says otherwise | Chart runtime |
Current surface
| Need | TradeScript surface |
|---|---|
| Main pane indicator | panePlacement: 'main' |
| Separate pane indicator | panePlacement: 'separate' |
| Comparison same scale | same-price-scale |
| Comparison percent scale | same-percent-scale |
| Comparison new scale | new-price-scale |
| Comparison new pane | new-pane |
| Price scale settings | PriceScaleSettings |
| Object properties editor | chart.showPropertiesDialog('pane:<paneId>') for pane height/state, chart.showPropertiesDialog('price-scale:main') for the full native price-scale settings object, and chart.showPropertiesDialog('price-scale:slot:<slotId>') for slot label/placement/pane/order/metadata |
| Price-axis scale controls | Built-in menu actions for move-left/right, invert, lock/free, currency/unit-label visibility, and reset routed through setPriceScale(...) / resetPriceScale() |
| Pane resize persistence | pane-drag and pane-drag-end with PaneLayoutPayload.panes[] |
| Pane order persistence | getPaneLayout(), setPaneOrder(paneIds), and pane-order-change |
| Pane height and state control | setPaneHeight(paneId, height), maximizePane(paneId), minimizePane(paneId), restorePane(paneId), and pane-layout-change |
| Built-in pane reorder UI | Separate indicator/comparison pane headers expose move-up/down buttons and drag/drop reorder routed through setPaneOrder(...); comparison pane controls honor ToolbarCustomization.paneButtonsVisible including onMouseOver |
| Hidden indicator axis | priceScale: 'no-scale' creates a hidden, non-interactive pane axis while preserving the value transform used to draw the indicator |
| Indicator scale reassignment | chart.updateIndicator(indicatorId, { priceScale, paneId }); the updated placement applies to the live indicator |
| Host-defined scale slots | priceScaleSlots define named scale identities that route to as-series, new-left, new-right, or no-scale, persist in ChartState / layouts, and can share a pane without sharing a transform. |
| Built-in indicator scale picker | The price-axis menu lists active indicators, shows current scale/slot labels, and routes built-in or host-defined slot choices through chart.updateIndicator(...) |
Source visibility and scale ownership
Every native scale owns an explicit set of chart sources. Candles, comparisons, and indicators resolve through source -> scale ID -> pane -> axis placement, and the same ownership records drive visibility and range calculation. ChartDisplaySettings.hidePriceScaleIfAllSourcesHidden defaults to true, so hiding the final visible source removes that scale's axis strip. Use chart.getPriceScaleSources(scaleId, paneId?) to inspect the ownership.
Independent comparisons are native chart scales. They do not reuse the main axis rectangle or paint a second set of labels over it.
Indicator scale mapping
| Placement | TradeScript behavior |
|---|---|
new-left | Independent left-side axis strip in the source pane |
new-right | Independent right-side axis strip in the source pane |
no-scale | Hidden scale with a retained value transform |
as-series | Main candle pane scale attachment |
forceOverlay | Main candle pane override |
Pass placement through AddBuiltInIndicatorOptions.priceScale, AddBuiltInIndicatorOptions.paneHeight, IndicatorDefinition.priceScale, or IndicatorDefinition.paneHeight. Reassign an existing indicator with chart.updateIndicator(indicatorId, { priceScale, paneId, paneHeight }).
For named scale targets, add priceScaleSlots and assign an indicator with metadata.priceScaleSlotId. The slot ID becomes the source's stable priceScaleId; paneId identifies the plot that owns the strips. Omitted pane IDs default to candle_pane. Use updatePriceScaleSlot(...), removePriceScaleSlot(...), showPropertiesDialog('price-scale:slot:<slotId>'), or the generic object APIs to edit scale definitions.
Related pages
- Price Scale — appearance, modes, and interaction of a single scale.
- Time Scale — the shared horizontal domain all panes align to.
- Object Tree — pane and price-scale-slot rows as manageable objects.