UI Elements
Find the region you can see first, then follow the page that owns its behavior and configuration. TradeScript separates chart-owned UI, host-composed panels, and adapter-owned data so a visual feature never becomes a second source of truth.
The terminal at a glance
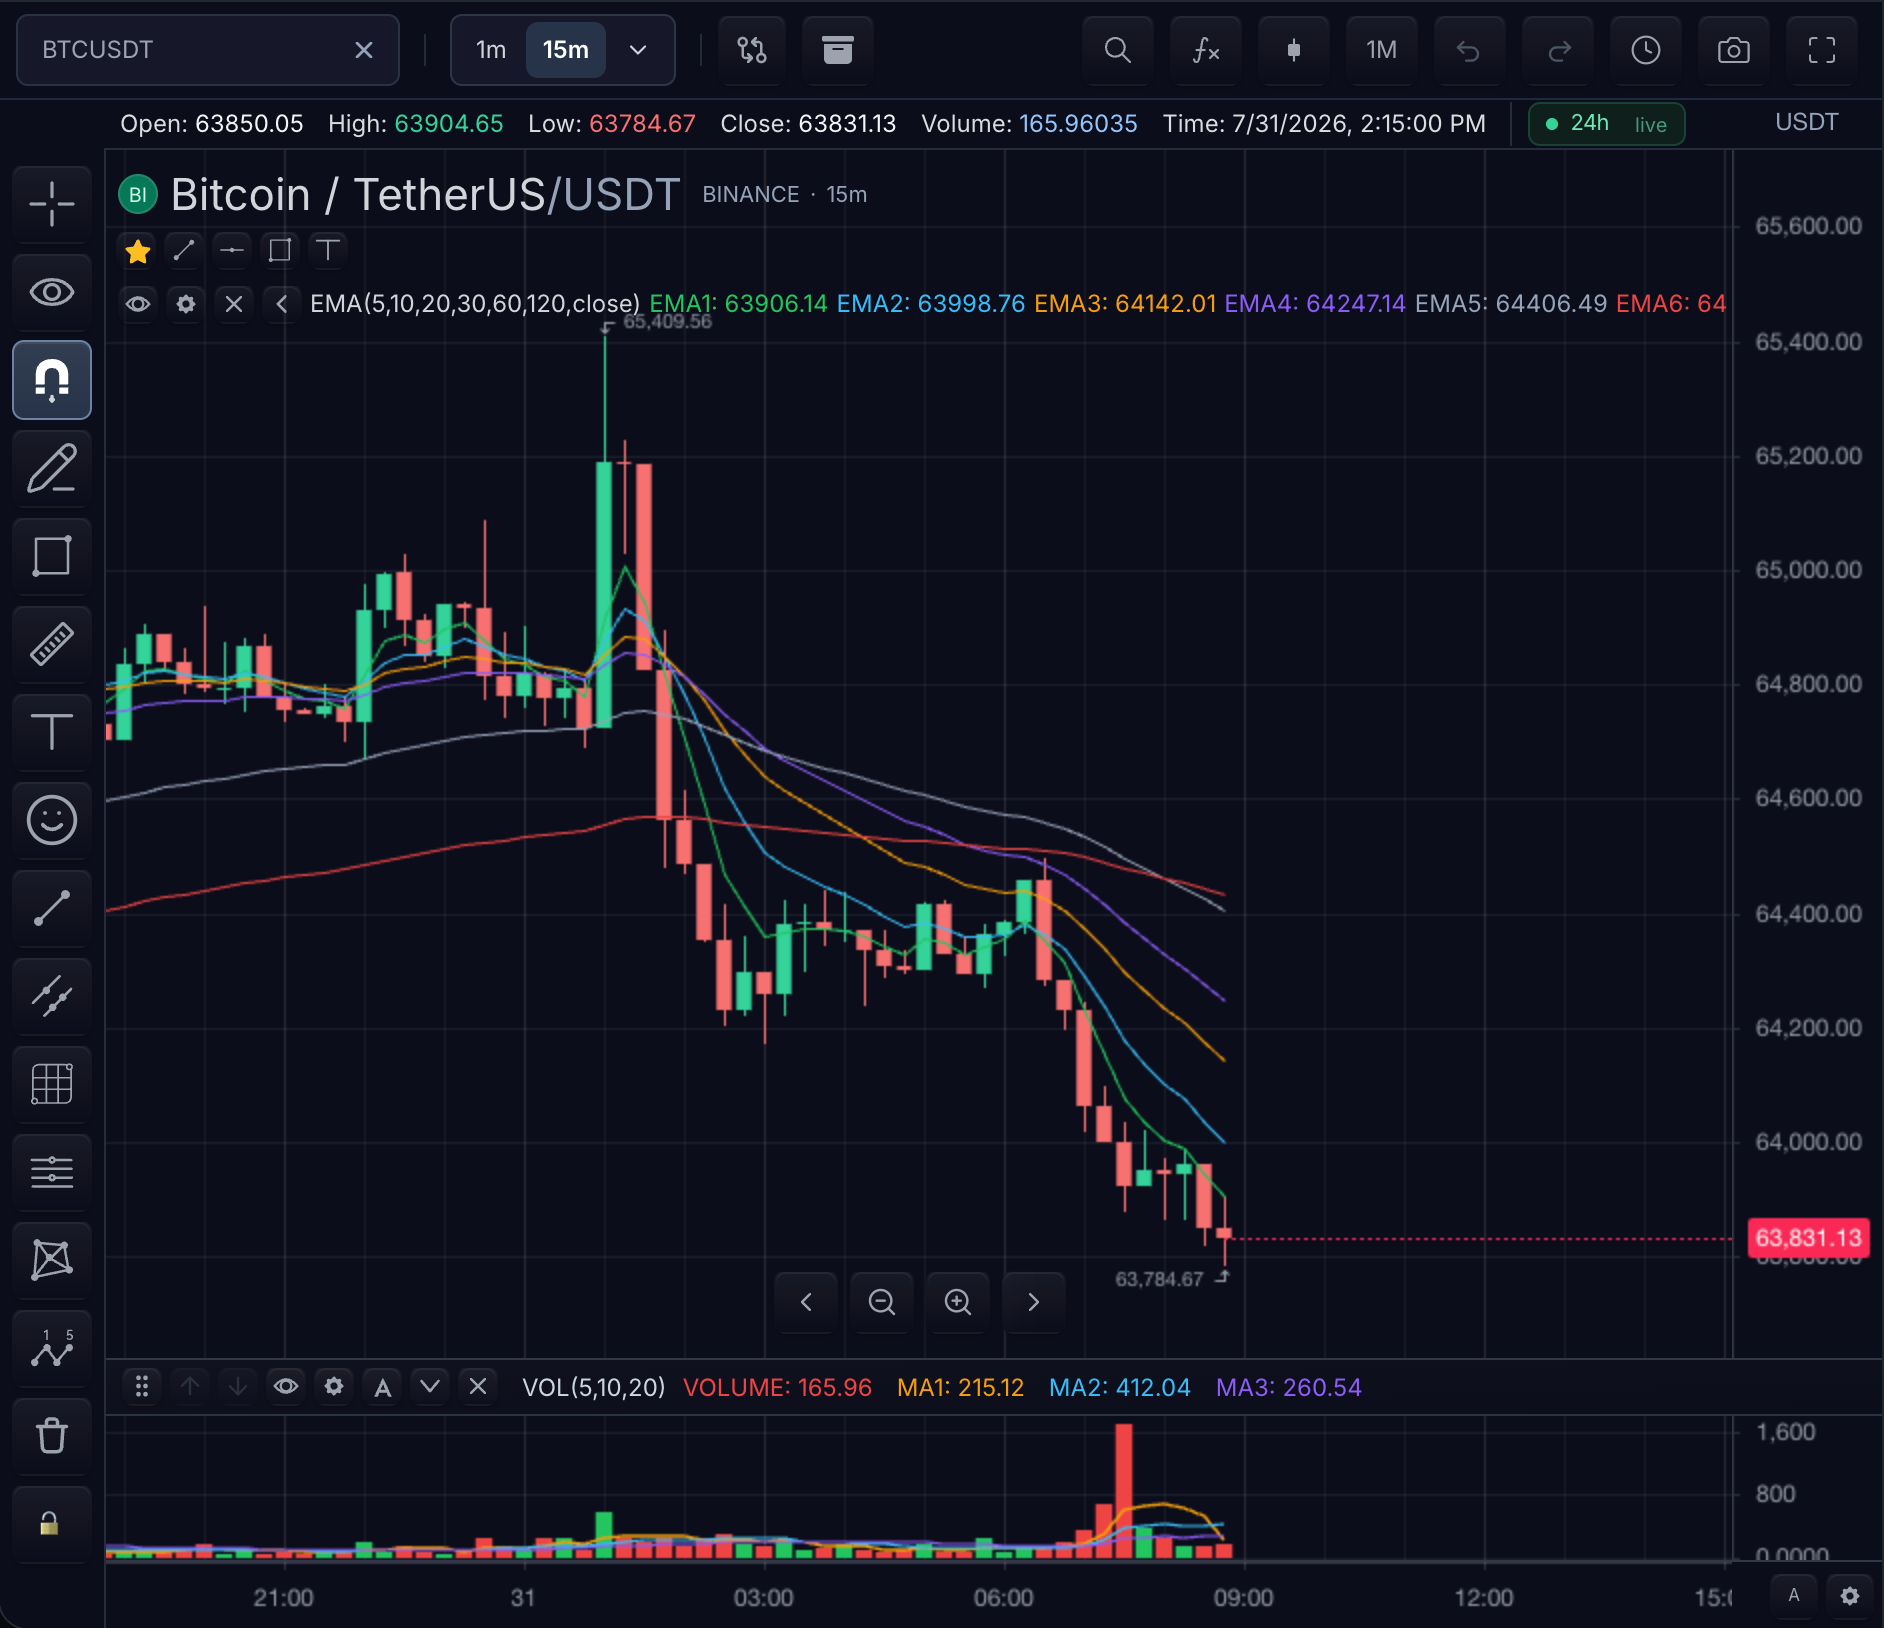
BTCUSDT · 15m · dark theme — full widget chrome captured from the live playground.
Six regions make up the terminal:
- Top toolbar — symbol box, interval picker, compare, layout storage, symbol search, indicators, chart type, time range, undo/redo, timezone, snapshot, and fullscreen controls. Owned by
featuresgates pluscustomization().setToolbar(...). See Toolbars. - Legend — OHLCV values row, symbol identity row, and indicator rows with per-row controls. Owned by
LegendSettingsviacustomization().setLegend(...). See Legend. - Drawing toolbar (left rail) — tool families, magnet, visibility, remove, and lock controls. Owned by
features.drawingsand drawing settings. See Toolbars and Drawing Tools. - Price pane and indicator sub-panes — the chart canvas itself, stacked panes, and pane headers. See Chart and Panes and Scales.
- Price scale (right) — tick labels, last-price label, and the currency/unit header. Owned by
PriceScaleSettingsandChartDisplaySettings. See Price Scale. - Time scale (bottom) — time labels and viewport navigation. See Time Scale.
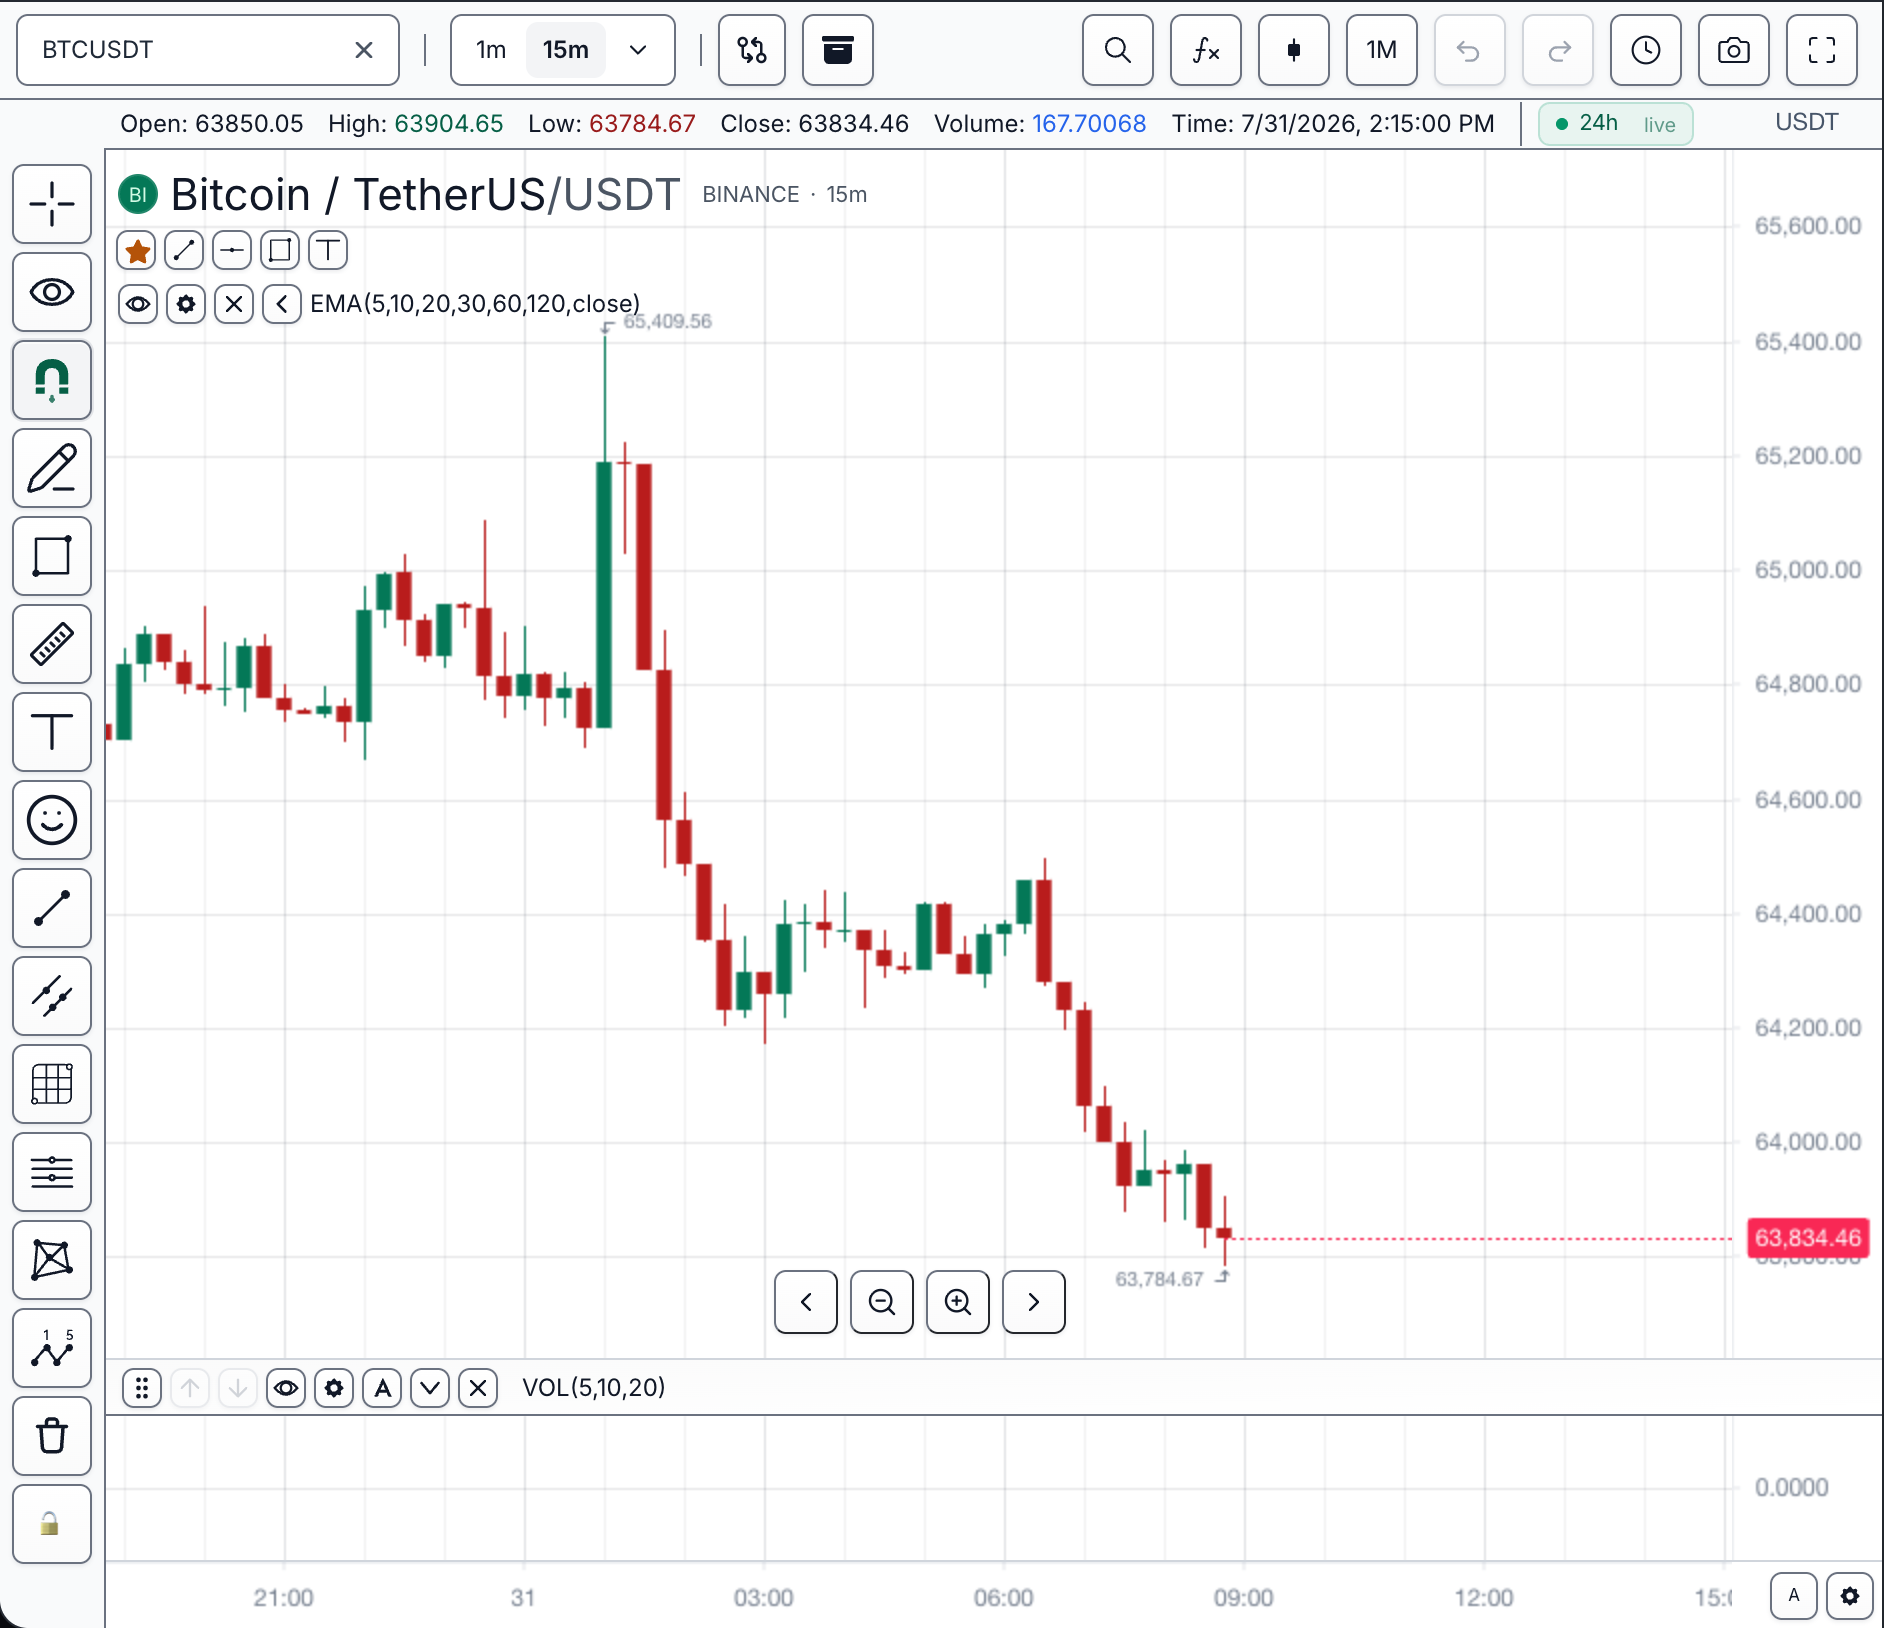
BTCUSDT · 15m · light theme — the same chrome under the light preset; see Themes.
Navigate by visible region
| Region | Start here | Owner |
|---|---|---|
| Center chart, legend, panes, and scales | Chart, Legend, Panes and Scales | Chart/widget |
| Top and left controls | Toolbars, Resolution, Symbol Search Surface | Chart customization + feature gates |
| Watchlist and account panels | Watchlist, Trading | Host composition + datafeed/broker adapters |
| Data inspection | Data Window, Chart Data Table, Instrument Details | Datafeed or chart export, as documented |
| Drawings, marks, and snapshots | Drawing Tools, Marks, Snapshots | Chart objects + adapter inputs |
Navigate by task
Change what the chart shows
- Switch symbol or interval from the toolbar — Symbol Search Surface, Resolution
- Change the chart type or add indicators — Toolbars, Indicators
- Overlay another symbol — Comparisons
Read values off the chart
- Hover values and per-series rows — Legend
- Dense OHLC/indicator inspection — Data Window, Chart Data Table
- Session and market state — Market Status, Timezone Selector
Control axes and layout
- Price axis modes, sides, and labels — Price Scale
- Zoom, scroll, ranges, and presets — Time Scale
- Pane creation, resize, collapse — Panes and Scales
Annotate and export
- User and API drawings — Drawing Tools
- Feed-owned event marks — Marks, Market Events
- Image export and sharing — Snapshots
Next steps
- Chart — mount, readiness, and chart-level control.
- Toolbars — built-in controls and application actions.
- Styling — themes, features, slots, and accessibility.
- Product surfaces — mobile, watchlist, session, workspace, and trading experiences.