Marks
Marks are small event badges anchored to the chart: feed-owned bar marks inside the panes, feed-owned timescale marks on the bottom axis, and host-owned SDK markers at explicit points. The three are separate typed contracts, so a feed that serves no marks still renders host markers, and a host that defines none still renders feed marks.
Choose the mark contract
| Need | Contract | Anchor | Click event |
|---|---|---|---|
| Feed-owned event on a bar | getMarks / TimeMark | Loaded bar time and chart pane | marker-click with original mark metadata |
| Feed-owned event on the time scale | getTimescaleMarks / TimeScaleMark | Time-scale timestamp | timescale-mark-click |
| Host or application annotation | MarkerDefinition APIs | Explicit marker points | marker-click when interactive |
Where each contract renders
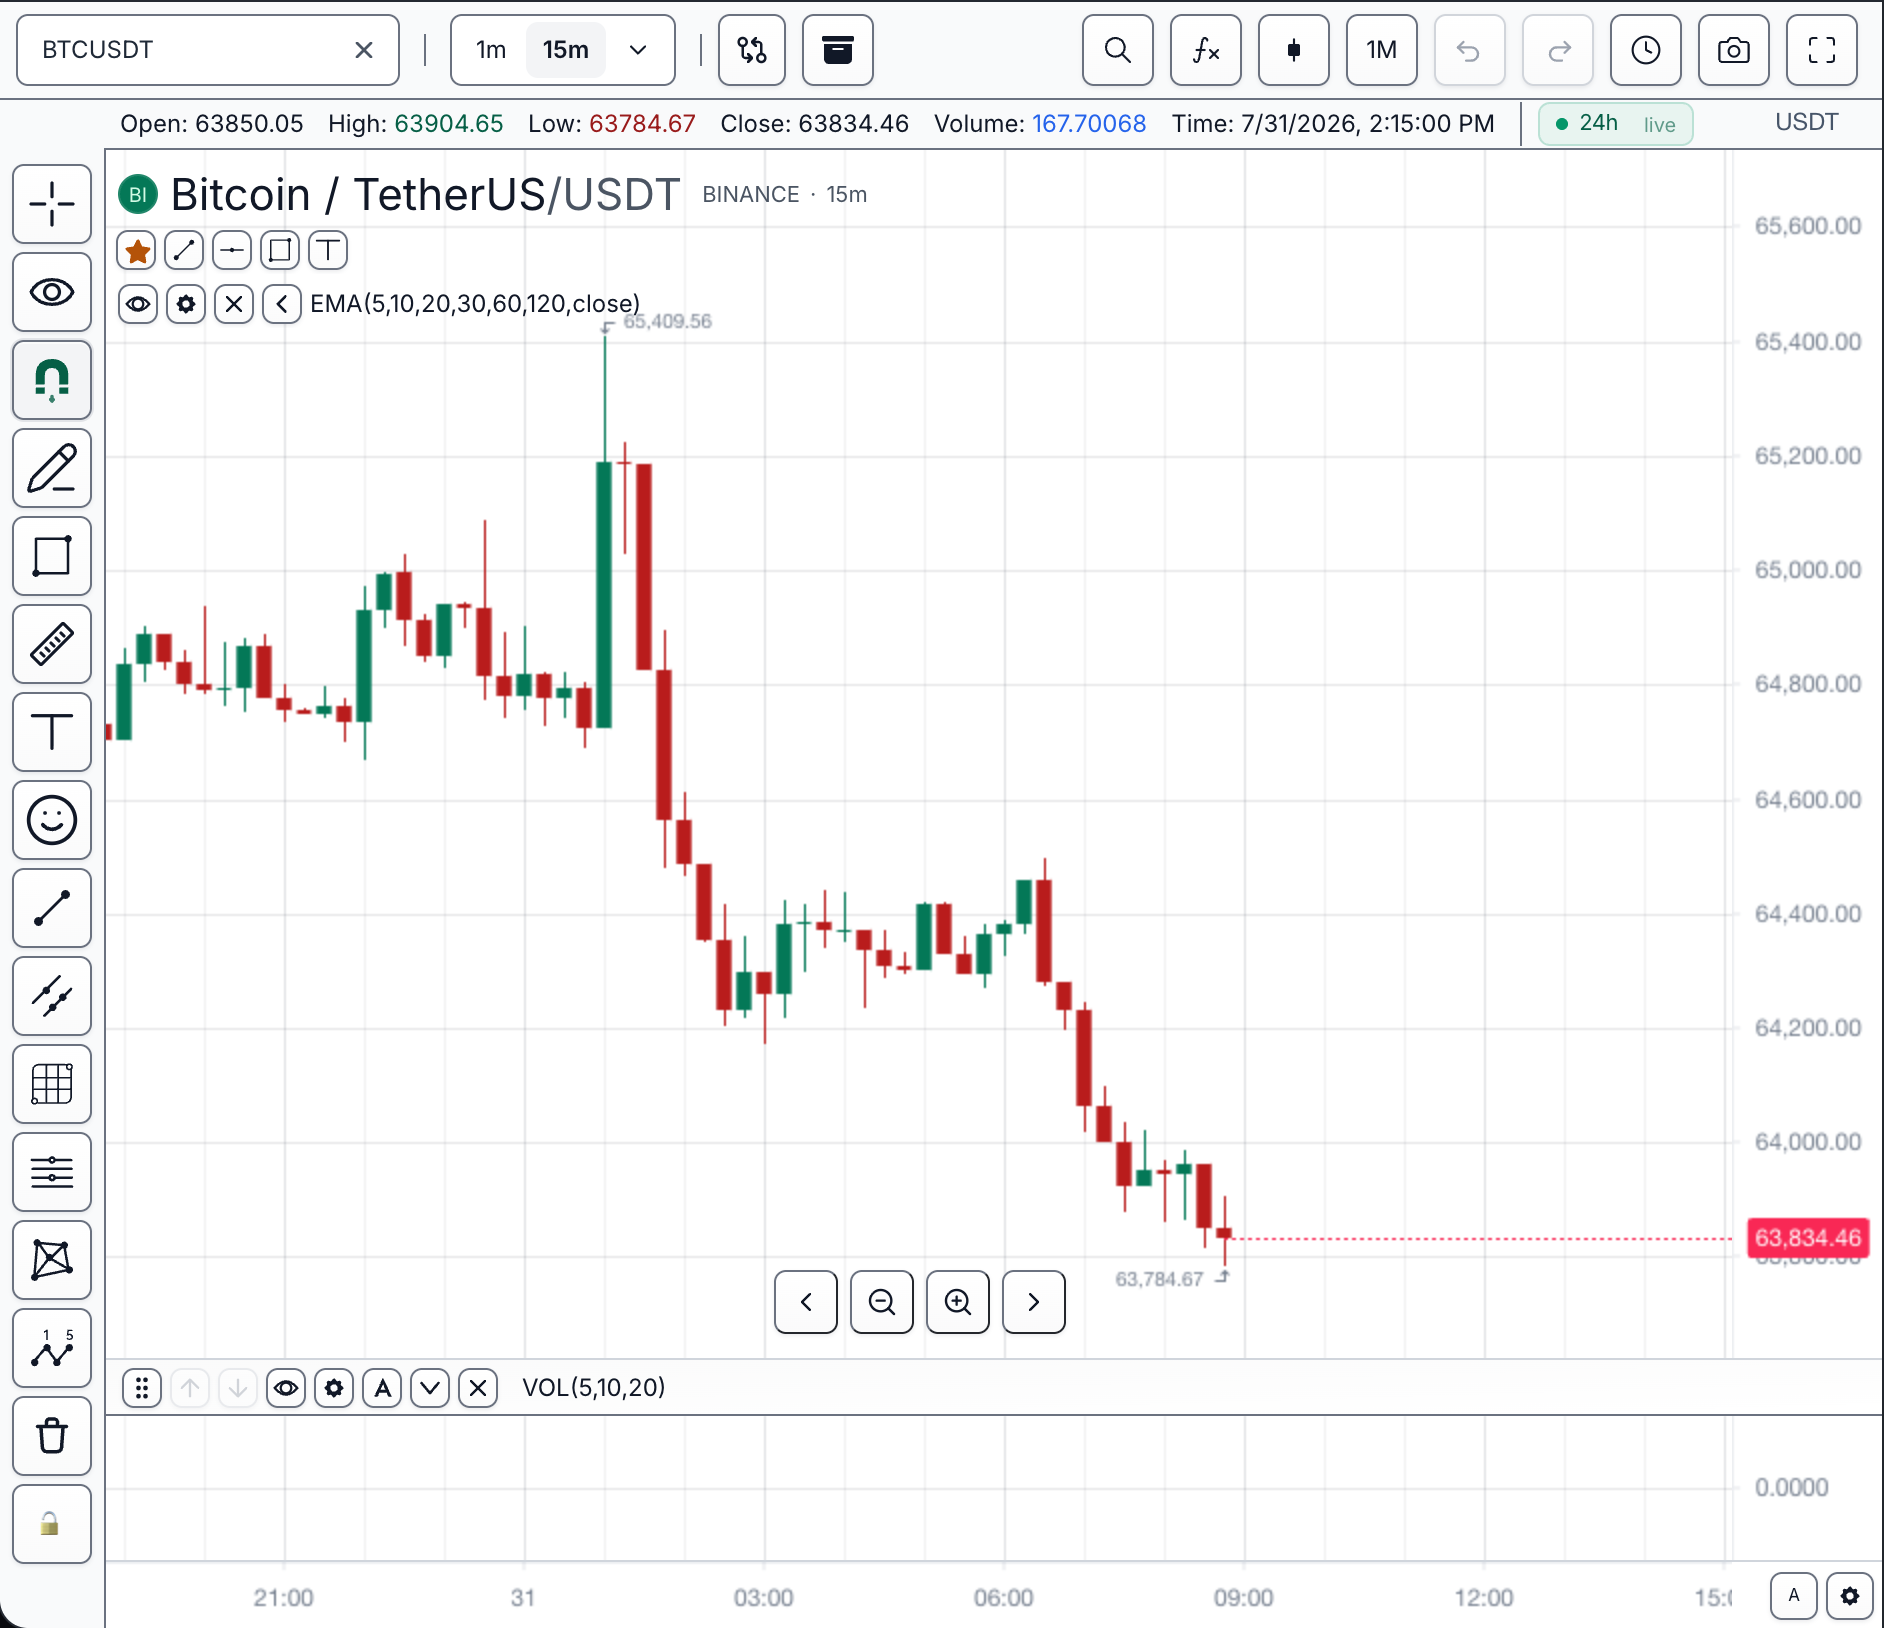
BTCUSDT · 15m · light theme — no feed marks are present in this capture; the callouts locate where each contract renders.
Three surfaces anchor a mark:
- Price and indicator panes — datafeed bar marks (
getMarks/TimeMark) render here as scoped SDK markers anchored at loaded bar times, and hostMarkerDefinitionmarkers render at their explicit points on any pane and scale. - Bottom time axis — timescale marks (
getTimescaleMarks/TimeScaleMark) render on this strip as locked chart objects at their timestamps. - Loaded history span — both feed contracts are fetched for the loaded range and refreshed as history extends.
Density and overlap
At crowded density, group events that share a timestamp or reveal details on focus/click; do not let overlapping labels hide price or scale interaction.
- Keep visible mark labels short:
TimeMark.labelrenders one character by default;ChartDisplaySettings.datafeedMarkLabelLength: 2allows two. - For timescale marks with artwork,
TimeScaleMark.imageUrlreplaces the label by default; setshowLabelWhenImageLoaded: trueonly when the short label stays legible over the image. - Put dense event streams behind grouped semantic providers instead of individual badges — see Market Events for typed earnings, dividends, corporate actions, news, and futures lifecycle dates.
- Keep tooltips (
tooltip/text) as the detail surface so the on-chart badge can stay small.
Datafeed bar marks
| Need | TradeScript surface |
|---|---|
| Datafeed marks | MarketDataFeed.getMarks(request) |
| Capability flag | MarketDataFeedConfig.supportsMarks |
| Runtime fetch | MarketDataControllerApi.getMarks(request) |
| Bar-mark label length | ChartDisplaySettings.datafeedMarkLabelLength |
| Mark payload | TimeMark (colors via TimeMarkColor) |
| Click event | on('marker-click', handler) with the original TimeMark under marker.metadata.datafeedMark |
Timescale marks
| Need | TradeScript surface |
|---|---|
| Datafeed timescale marks | MarketDataFeed.getTimescaleMarks(request) |
| Timescale capability flag | MarketDataFeedConfig.supportsTimescaleMarks |
| Runtime timescale fetch | MarketDataControllerApi.getTimescaleMarks(request) |
| Timestamp placement | ChartDisplaySettings.timescaleMarkTimePlacement |
| Mark payload | TimeScaleMark |
| Click event | on('timescale-mark-click', handler) |
SDK markers
| Need | TradeScript surface |
|---|---|
| Chart markers | addMarker, updateMarker, removeMarker, setMarkers, getMarkers, clearMarkers |
| Marker payload | MarkerDefinition |
| Clicks | MarkerDefinition.interactive: true + on('marker-click', handler) |
| Feed-mark refresh | chart.refreshDatafeedMarks() |
| Feed-mark clear | chart.clearDatafeedMarks() |
Click behavior
SDK markers opt into clicks with MarkerDefinition.interactive: true; clicks emit marker-click with the marker id, cloned marker payload, and first marker point.
Datafeed marks returned from MarketDataFeed.getMarks(request) render as scoped SDK markers in the datafeed-marks group. They preserve tooltip / text content, anchor at the loaded bar, and are interactive, so clicking them emits marker-click with the original TimeMark preserved under marker.metadata.datafeedMark. TimeMark.label renders as a visible one-character marker label by default; set ChartDisplaySettings.datafeedMarkLabelLength: 2 to show two characters.
TimeMark.color accepts either a constant color string or { background, border } via TimeMarkColor. The background color drives the marker fill, the border color drives the marker stroke, and TimeMark.borderWidth maps to marker stroke width.
Timescale marks returned from MarketDataFeed.getTimescaleMarks(request) are locked chart objects. By default they appear at TimeScaleMark.time. Set ChartDisplaySettings.timescaleMarkTimePlacement: 'bar-end' to place them at the inferred bar end time. The chart uses the next loaded bar timestamp when available and otherwise uses the active interval duration. Tick intervals stay on the source timestamp because they do not have a finite wall-clock duration. Clicking a mark emits timescale-mark-click with { markId, mark, time }.
Timescale marks can carry imageUrl. When an image is present, the label is hidden by default; set TimeScaleMark.showLabelWhenImageLoaded: true to keep the short label visible over the image mark.
Refresh and clear
The chart refreshes datafeed marks whenever history loads extend the series. Hosts can call chart.refreshDatafeedMarks() to refetch both bar marks and timescale marks for the current loaded history span, and chart.clearDatafeedMarks() to clear only feed-owned marks without touching host-owned SDK markers. Keep generic visual annotations on marks. Use Market Events for typed earnings, dividends, corporate actions, news events, futures lifecycle dates, and registered custom:* sources. The SDK never converts or deduplicates legacy marks against semantic events.
Related pages
- Market Events — semantic, provider-based event markers
- Datafeed reference — the
getMarks/getTimescaleMarkscontracts - Events reference —
marker-clickandtimescale-mark-clickpayloads - Time Scale — the axis strip timescale marks render on