Legend
The legend is the value-and-identity layer rendered over the chart panes: OHLCV values, the symbol identity row, quote fields, indicator rows with their own controls, and custom market-status sections. Every one of those regions is configurable at runtime through LegendSettings, and every one has a defined appearance when its underlying value is missing.
Anatomy
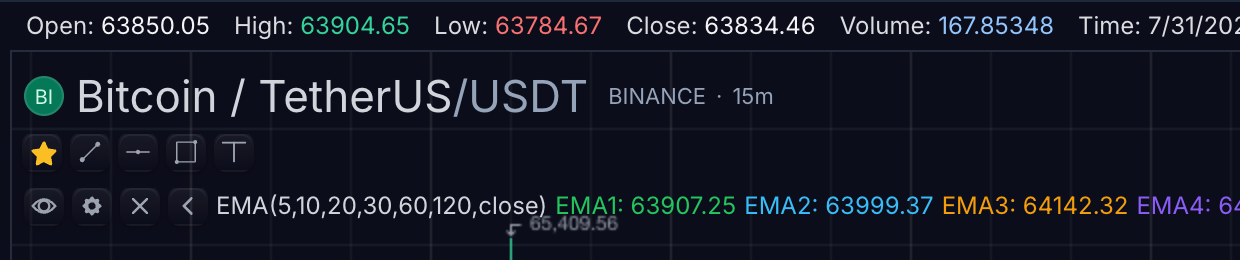
BTCUSDT · 15m · dark theme — legend region captured from the live playground.
Four rows stack from the top of the pane:
- Values row —
Open / High / Low / Close / Volume / Timefor the bar selected byLegendSettings.valueSource(crosshair bar, latest loaded bar, or rightmost visible bar). Visibility:showValues. - Symbol identity row — symbol logo (
showSymbolLogo), title fromsymbolTitleSource, exchange, and interval. Editable affordances come fromeditableSymbolandeditableInterval. - Drawing favorites row — the starred drawing shortcuts under the identity row. This row is drawing chrome, not a legend row; its placement is
ChartDisplaySettings.favoritesToolbar. - Indicator row —
EMA(5,10,20,30,60,120,close)with hide, settings, and remove buttons plus per-output value chips. Controlled byshowIndicatorRowsand the button toggles below.
Interactions
- Clicking the symbol or interval (when
editableSymbol/editableIntervalare on) opens symbol search or the interval picker. - When
showContextMenuis enabled, symbol and indicator legend rows expose a dedicated row context menu. showLegendButtonshides all inline legend buttons, whileshowHideButton,showSettingsButton, andshowDeleteButtonsuppress those icons independently without changing the underlying native chart APIs.- Hiding a button removes the affordance, not the capability. The corresponding chart API stays callable from host code.
Value formatting
valueSourceselects whether no-crosshair legend values use the latest loaded bar or the rightmost visible bar; with a crosshair active, values track the crosshair bar.unavailableValueLabelcontrols unavailable candle and indicator legend value text — never show stale values as current.- The volume quote field uses the active chart locale for compact number formatting, and quote timestamp fields use the active chart locale and timezone.
- Change and change-percent quote fields use signed value colors by default; set
LegendSettings.changeValueColoring: 'none'to render them with the default legend text color. - Use
LegendSettings.backgroundVisible,backgroundColor, andbackgroundOpacityfor the boxed main-series legend background.
Series and indicator states
| Region | Source | Loading or unavailable behavior |
|---|---|---|
| Symbol title/logo | Resolved SymbolInfo | Keep a text identity when a logo is absent |
| OHLCV row | Crosshair bar, latest bar, or rightmost visible bar per valueSource | Use unavailableValueLabel; never show stale values as current |
| Quote fields | getQuotes / subscribeQuotes | Hide or mark unavailable fields according to settings |
| Indicator rows | Indicator outputs and metadata | Hide null rows only when explicitly configured |
| Market status | Session/data status plus host status sections | Show the documented fallback when schedule data is missing |
Per-state controls:
hideUnavailableIndicatorValuesomits indicator legend rows whose current output is null or undefined.showValuesOnMobilekeeps candle legend values visible on compact/mobile layouts even if desktop value rows are hidden.showIndicatorTitles: falsehides indicator names;showIndicatorValues: falsehides indicator output rows.showBooleanIndicatorArguments: falseomits boolean values from indicator argument text;showIndicatorInputValues: falsehides indicator input values from legend argument text.hideMainSeriesSymbolFromIndicatorLegend: trueomits symbol input values when they match the active chart symbol.showDataStatusInLegendrenders delayed, end-of-day, or offline data status fromSymbolInfo.dataStatus.
Quote fields and market status
- Known quote fields include
last,bid,ask,spread, OHLC values, previous close, volume, extended-hours values, quote status, and timestamps. - Unknown field names are read from
Quote.metadata, so hosts can add venue-specific legend chips without changing SDK code. - Use
LegendSettings.showQuoteFieldsandquoteFieldsfor explicit main-series fields such asvolume,change, andchangePercent. showLastDayChangeincludes previous-day change and percent-change values in the main-series legend even when broader quote fields are hidden.showPriceSourceInLegendincludes the activeSymbolInfo.priceSourceId/priceSourceslabel in main-series and comparison legend labels.showComparisonSymbolLogorenders comparison-series legend logos fromSymbolInfo.logoUrls/logoUrl.- Market status sections render compact chips and can open a host-defined popup with details and action buttons. Their
statusfield accepts built-in market states or host-defined status ids, so venues can surface states such as auctions, halts, volatility pauses, or data-quality modes without waiting for an SDK enum update.
Customization
LegendSettingsis the single control surface. It governs overall visibility, the symbol logo and title rows, the editable symbol and interval affordances, the inline buttons, the value rows and their mobile policy, the indicator rows, the quote fields, and which bar supplies values when no crosshair is active.symbolTitleSourcecan useticker,name,description,long-description,ticker-and-description, orticker-and-long-description, so feeds can surface long exchange descriptions without host string rewriting.- Runtime API:
chart.customization().setLegend(settings). - Symbol metadata and market status come from
SymbolInfo, session schedules, quote data, and data status.
chart.customization().setLegend({
  visible: true,
  editableSymbol: true,
  editableInterval: true,
  showSymbolLogo: true,
  showComparisonSymbolLogo: true,
  showSymbolTitle: true,
  symbolTitleSource: 'ticker-and-description',
  showContextMenu: true,
  showLegendButtons: true,
  showHideButton: true,
  showSettingsButton: true,
  showDeleteButton: true,
  showValues: true,
  showValuesOnMobile: true,
  unavailableValueLabel: 'N/A',
  hideUnavailableIndicatorValues: true,
  showBooleanIndicatorArguments: false,
  showIndicatorRows: true,
  showQuoteFields: true,
  showLastDayChange: true,
  showPriceSourceInLegend: true,
  showDataStatusInLegend: true,
  quoteFields: ['last', 'bid', 'ask', 'spread', 'changePercent', 'extendedLast', 'extendedChangePercent', 'volume', 'venue'],
  valueSource: 'last-visible',
  showMarketStatus: true,
  statusSections: [
    {
      id: 'venue',
      label: 'NYSE',
      status: 'auction-imbalance',
      value: 'Auction imbalance',
      color: '#38bdf8',
      icon: 'clock',
      tooltip: 'Opening auction imbalance',
      details: [{ label: 'Imbalance', value: '1.2M buy' }],
      action: { label: 'Session details', actionId: 'open-session-details' },
    },
  ],
});
Rendered rows
- The floating SDK legend row renders the symbol logo/title chip, comparison symbol logos when enabled, configured quote fields, and custom market-status sections.
- Main-pane indicator rows render over the chart pane with hide/show, settings, code-edit, remove, and value chips when enabled.
- Subpane indicator headers render hide/show, settings, code-edit, auto-fit, collapse/expand, remove, provider status, and value chips.
- The period bar remains the primary symbol/interval control. The data window remains the dense inspection surface for OHLC/indicator values.
Related pages
- Market Status — the status chips and popup surface in detail
- Data Window — dense OHLC/indicator inspection
- Symbol Search Surface — what the editable symbol affordance opens
- Indicators — the indicators behind indicator rows