Chart
The native chart surface is ChartApi. Reach it through (await sdk.chart.mount(options).ready()).chart(), or directly from createChart(mount, options) in a plain-JavaScript host. Users see it as the central canvas: stacked panes with the main series, indicator sub-panes, the legend, and the price and time scales around it.
Anatomy
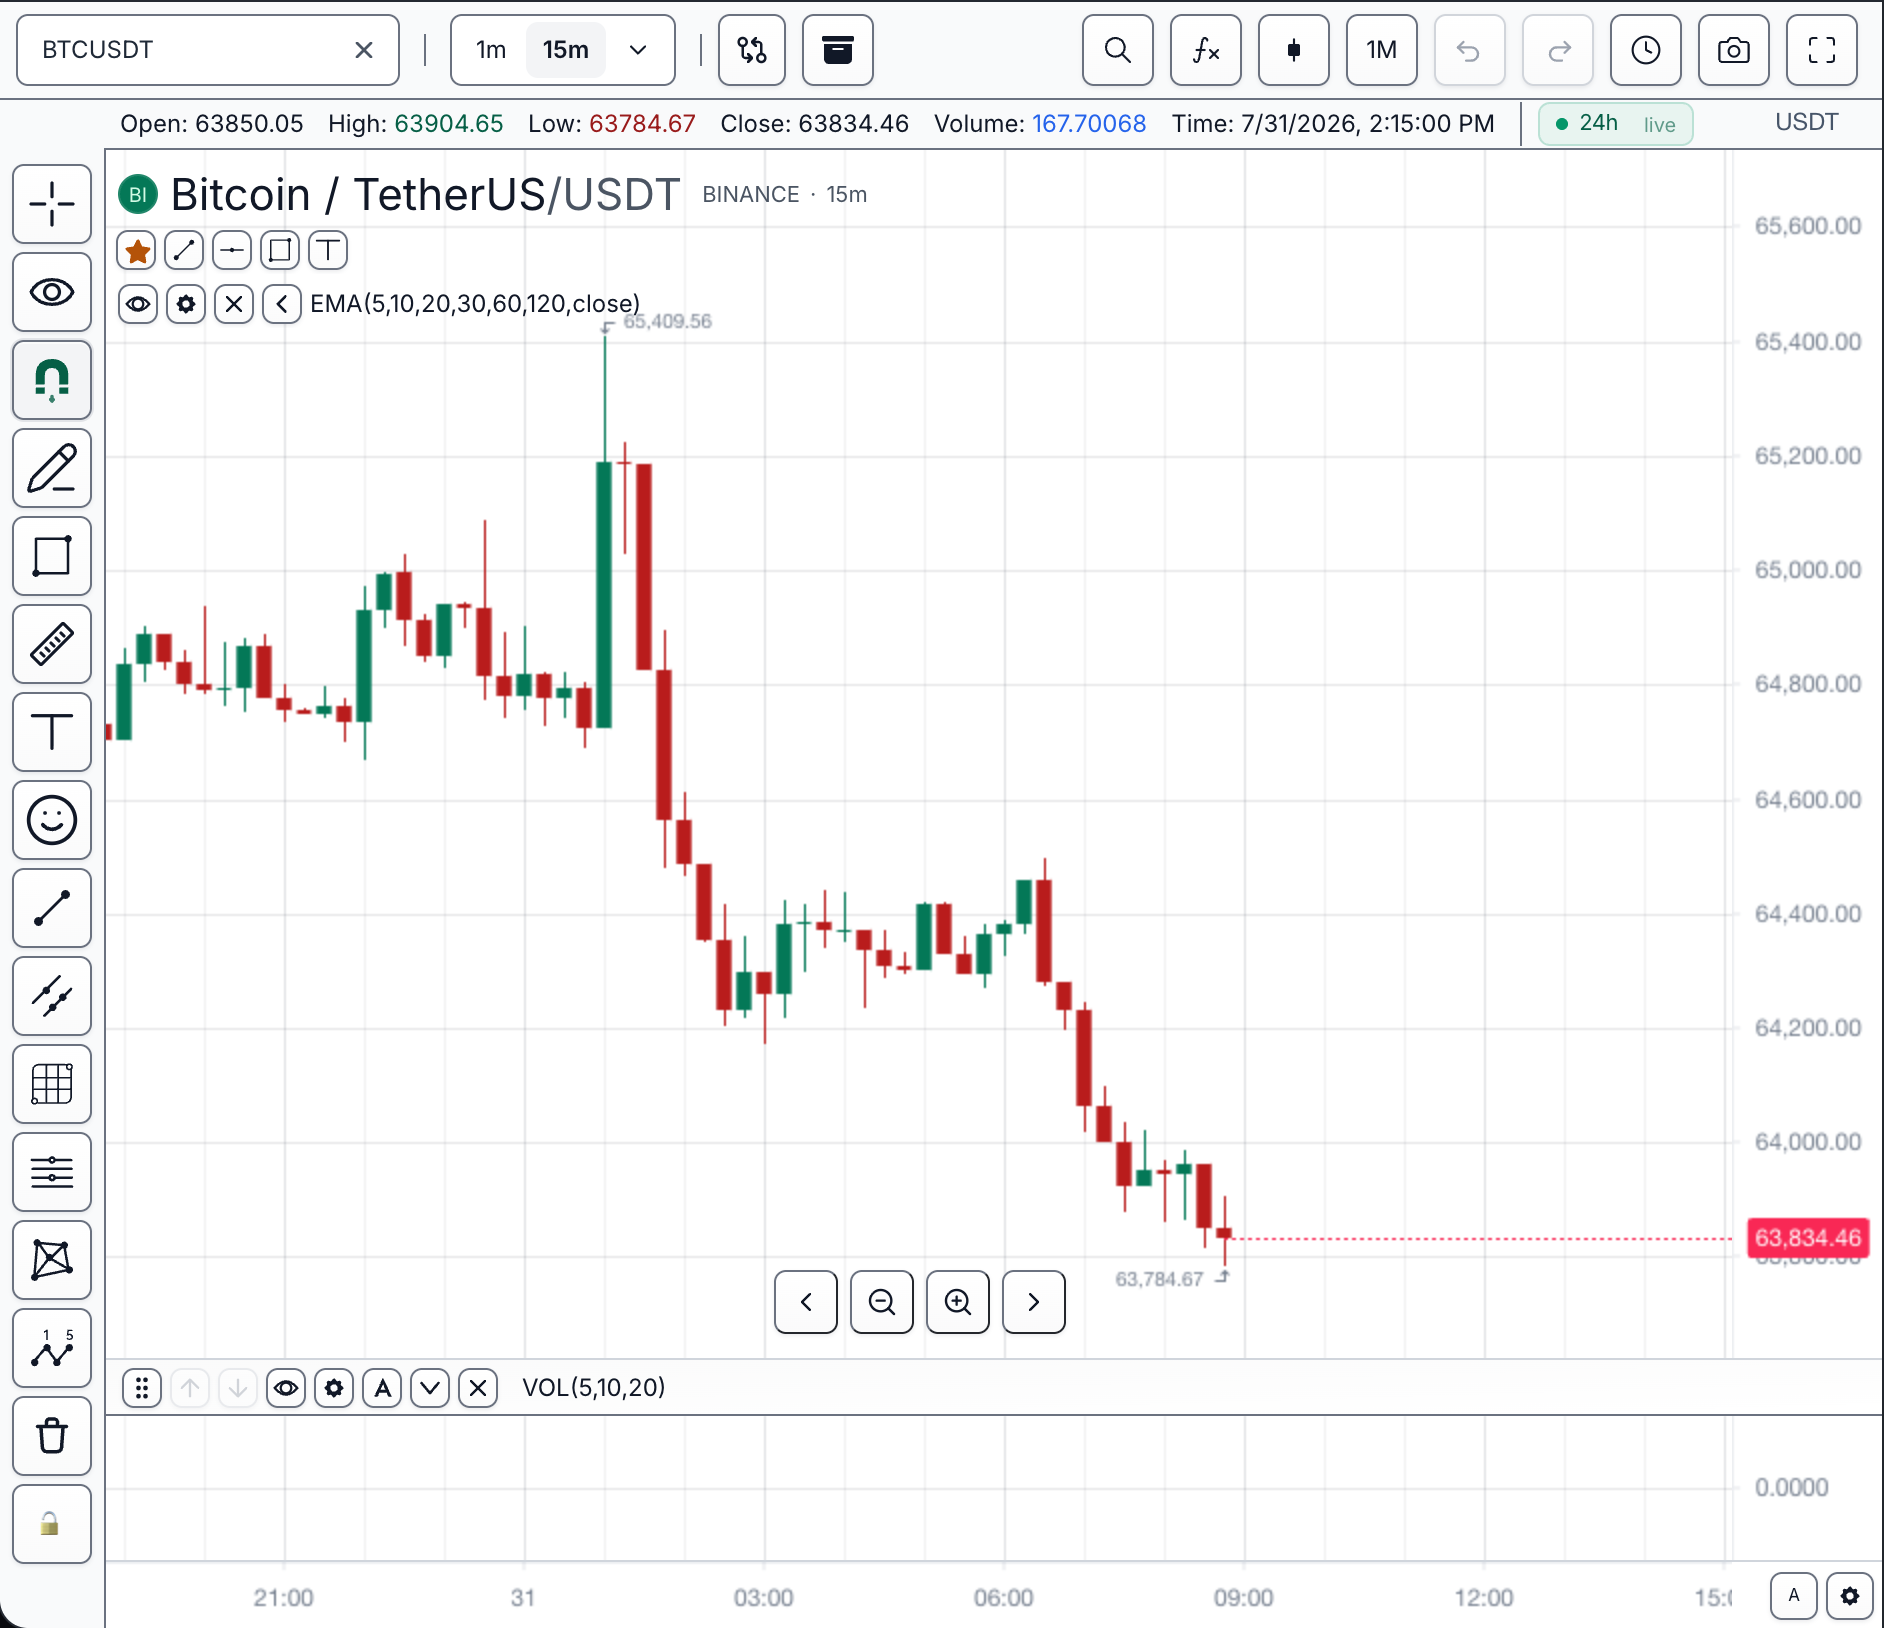
BTCUSDT · 15m · light theme — full widget chrome captured from the live playground.
Ten regions make up the default chart chrome:
- Top toolbar — symbol box, interval controls, and view/actions cluster. Configured through
featuresandcustomization().setToolbar(...). See Toolbars. - OHLCV strip and symbol identity row — current bar values, symbol logo, name, exchange, and interval. Configured through
LegendSettingsviacustomization().setLegend(...). See Legend. - Drawing favorites row — the compact row of starred drawing tools under the legend. Placement is
ChartDisplaySettings.favoritesToolbar('legend' | 'sidebar' | 'floating' | 'both'). - Indicator legend row —
EMA(5,10,20,30,60,120,close)with hide, settings, and remove controls. Indicators are managed withaddBuiltInIndicator,addIndicator,getIndicators, andremoveIndicator. See Indicators. - Left drawing toolbar — tool families, magnet, visibility, and lock controls, gated by
features.drawings. See Drawing Tools. - Price pane — the main series (candles here; switch with
setChartType) plus overlay indicator plots. - Volume sub-pane — a separate pane with its own header controls. Pane placement and behavior are covered in Panes and Scales.
- Price scale — tick labels and the highlighted last-price label on the right, owned by
PriceScaleSettingsandChartDisplaySettings. See Price Scale. - Time scale — date/time labels and viewport navigation along the bottom. See Time Scale.
- Bottom-right pane controls — auto-fit and settings buttons, configured with
ChartControlOptions.autoFitButtonandChartControlOptions.settingsButtonunderfeatures.chartControls.
Ownership and readiness
const mounted = sdk.chart.mount({ mount, symbol: 'AAPL', interval: '1D', datafeed });
const widget = await mounted.ready();

const chart = widget.chart();
await chart.setSymbol('MSFT');

mounted.destroy();
Use mounted.ready() before reading or changing the active chart. The host owns
the mount and widget lifecycle; ChartApi owns chart state; data and broker
adapters own external facts.
Current surface
| Chart capability | TradeScript surface | Related page |
|---|---|---|
| Chart mount | sdk.chart.mount(...) with mount, symbol, interval, and datafeed | Chart Widget |
| Full-window startup | fullscreen: true | Toolbars |
| Active chart | widget.chart() or workspace.chart(chartId) | Multi-Chart Workspace |
| Symbol and interval | setSymbol, getSymbol, setInterval, getInterval | Symbol Search Surface, Resolution |
| Visible range | setVisibleRange, getVisibleRange, getVisibleBarRange | Time Scale |
| Data reset | clearBars, then reload through symbol/interval/datafeed | Datafeeds |
| Indicators | addBuiltInIndicator, addIndicator, getIndicators, removeIndicator | Indicators |
| Drawings | createDrawing, listDrawings, updateDrawing, removeDrawing | Drawing Tools |
| Actions | customization().registerAction(...) | Toolbars |
| Snapshot | exportImage(...), uploadSnapshot(...) | Snapshots |
| Timezone | customization().setTimezone(...) | Timezone Selector |
ChartApi is the source of truth for chart state and interaction. Widget-level layout persistence is owned by widget.chartLayouts().
Related pages
- Toolbars — every control strip around the canvas
- Legend — values, identity, and indicator rows over the canvas
- Price Scale and Time Scale — the two axes
- Panes and Scales — pane lifecycle and scale assignment