TypeScript Stdlib
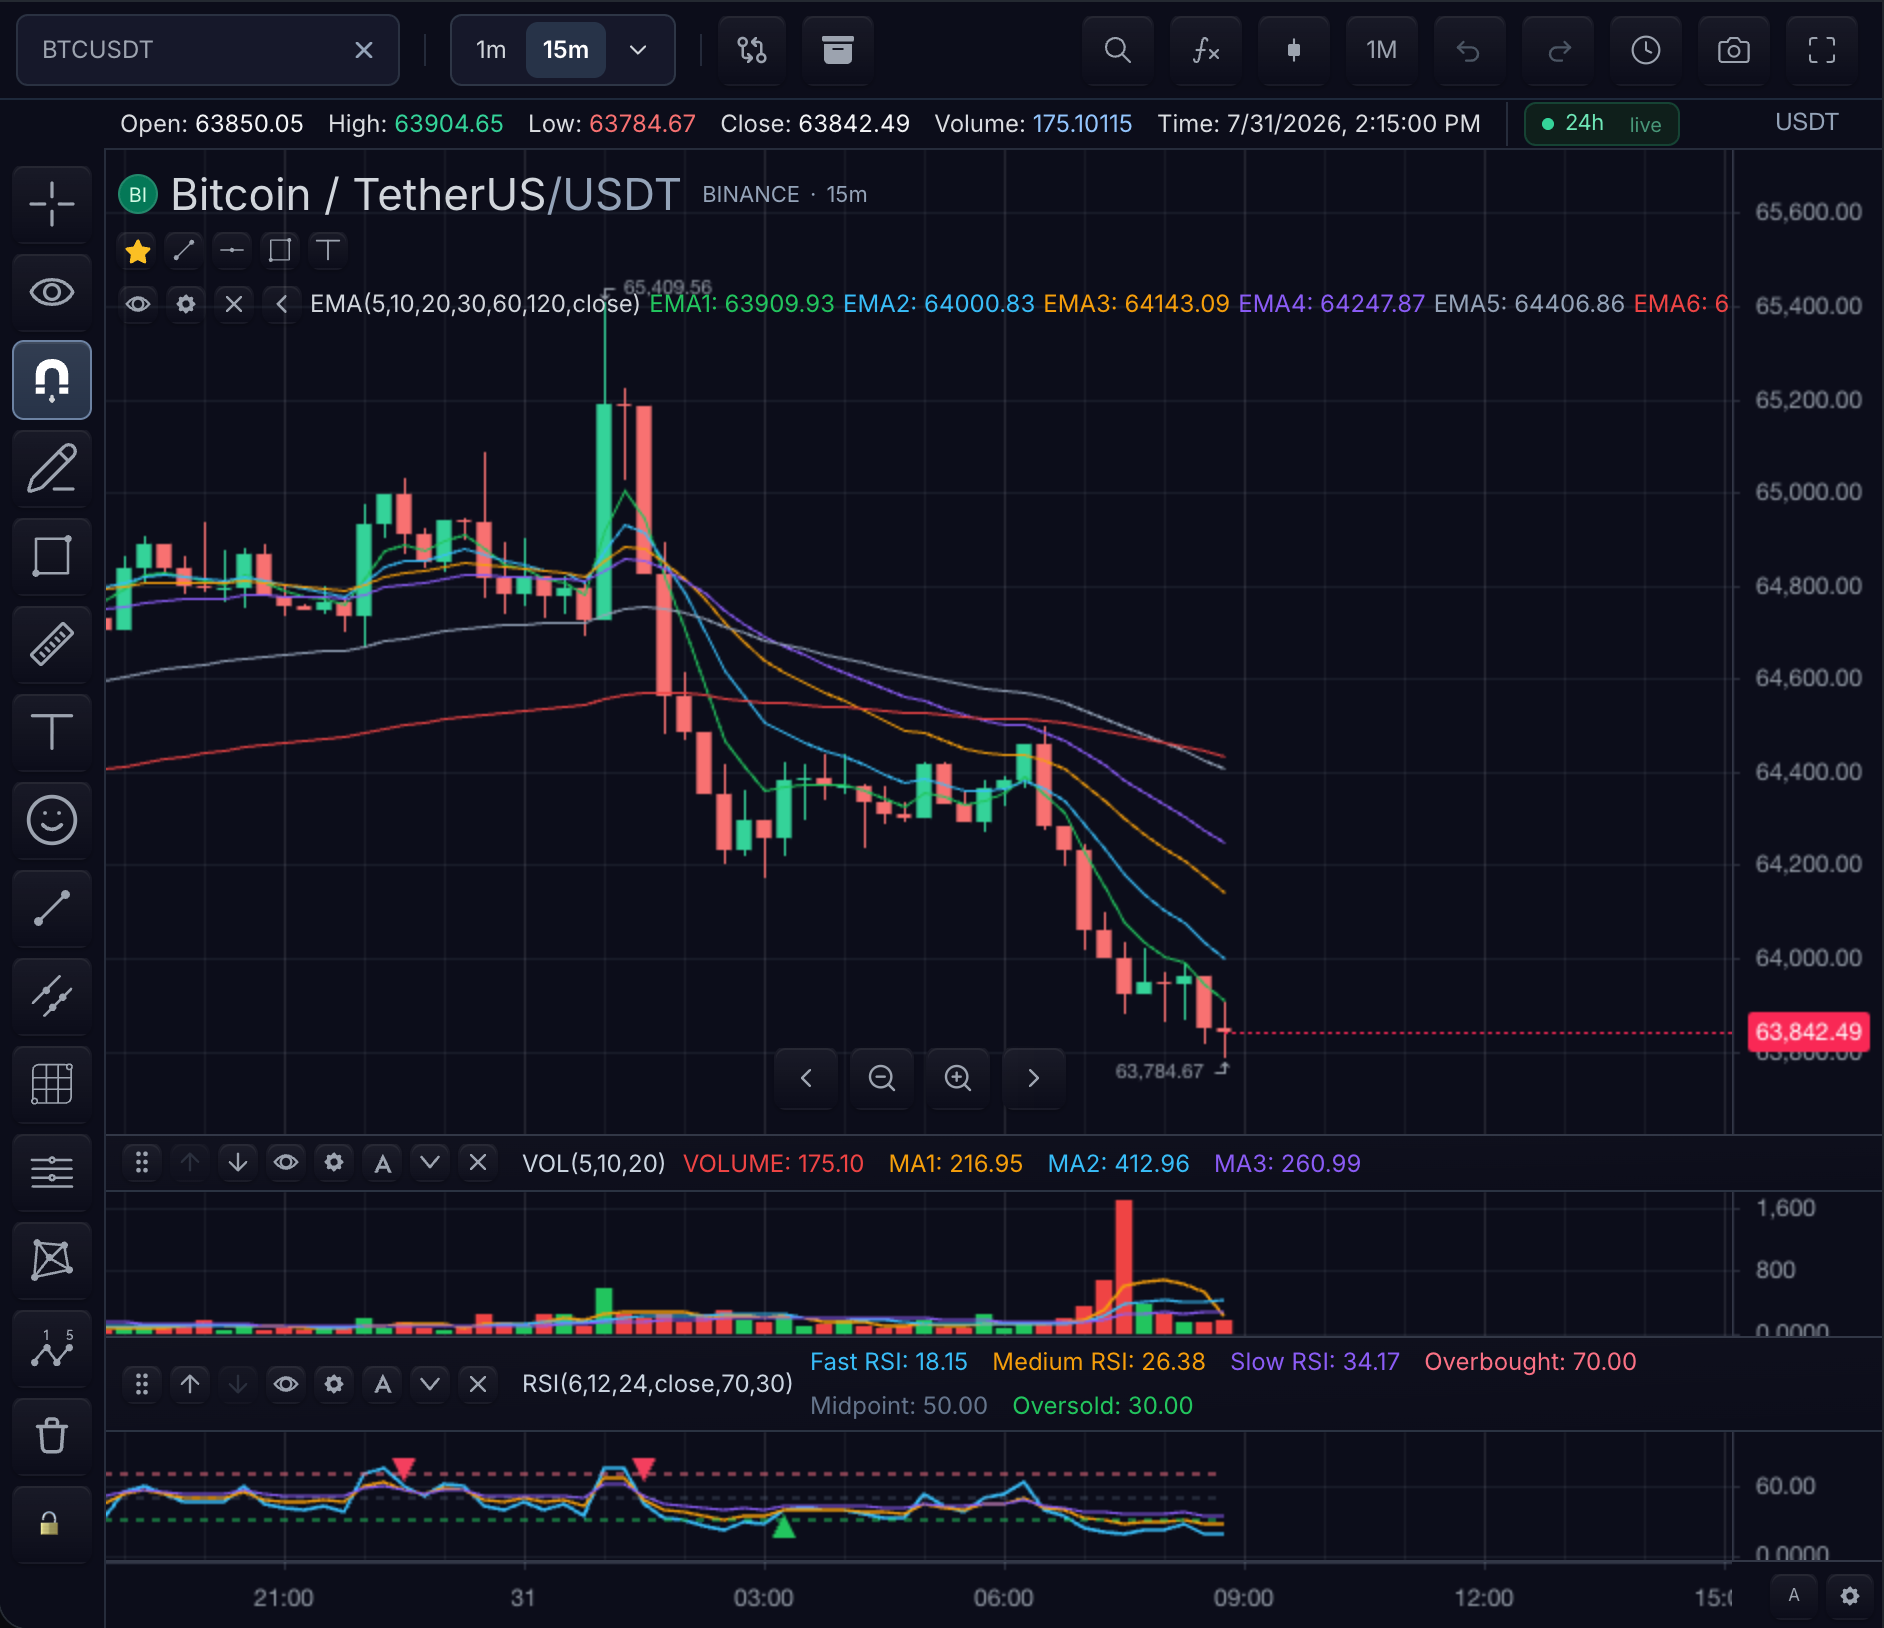
Custom indicators read the market series supplied by the chart, calculate values, and emit plots, markers, alerts, or drawing commands. Load secondary market data in your application, then use security(...) to read it in the indicator. The standard helpers cover moving averages, oscillators, series math, cross detection, and NaN handling.
- New to authoring? Start with Write a custom indicator.
- Language surface (
plot,input, …): Indicator language.
Find a helper by task
Start from what you are trying to do — each row links to the matching section below:
| Task | Reach for | Section |
|---|---|---|
| Read price / volume data | close, high, low, volume, hl2, hlc3 | Market series |
| Smooth a series / follow trend | sma, ema, rma, wma, vwma, alma | Moving averages |
| Measure momentum or overbought/oversold | rsi, stoch, macd, cci, mfi, willr, tsi | Oscillators / stats |
| Measure volatility / build bands | stdev, atr, tr, bbands, supertrend | Volatility |
| Detect signal crossings | crossover, crossunder, cross | Crosses |
| Find extremes and swings | highest, lowest, pivothigh, pivotlow | Series ops / Pivots |
| Combine or compare two series | add, sub, mul, div, gt, lt, iff | Math |
Handle warm-up gaps (NaN) | na, nz, fixnan | NaN helpers |
| Read the latest value | last | Math — utility |
| Branch on session / timeframe | year, month, hour, isintraday, isdaily | Calendar, Authoring surface |
The standard library is modular. Import the authoring API, technical analysis, and series math from the paths below.
Imports
| Import | Contents |
|---|---|
@tradescript/pro/sdk/indicators | Authoring: indicator, input, plot, marker, alert, draw, market series, security, context helpers |
@tradescript/pro/sdk/indicators/ta | Technical analysis |
@tradescript/pro/sdk/indicators/math | Series arithmetic, comparisons, trig |
Recommended style
import { indicator, input, plot, close } from '@tradescript/pro/sdk/indicators'
import * as ta from '@tradescript/pro/sdk/indicators/ta'
import { add, sub, mul } from '@tradescript/pro/sdk/indicators/math'

export default indicator('Bollinger', () => {
  const length = input.int('Length', 20, { id: 'length', min: 1 })
  const mult = input.number('Multiplier', 2, { id: 'mult', step: 0.1 })
  const basis = ta.sma(close, length)
  const dev = mul(ta.stdev(close, length), mult)
  plot.line(basis, { title: 'Basis', color: '#94a3b8' })
  plot.band(add(basis, dev), sub(basis, dev), { color: '#8b5cf6', fillOpacity: 0.15 })
}, { pane: 'price' })
Editor support
Use the TypeScript language service in your application editor for autocomplete, signatures, hover information, and go-to-definition.
Market series
When to use: these are your raw data — every calculation starts by reading one of them. All are full-length arrays aligned to the loaded bars.
| Export | Meaning |
|---|---|
time / open / high / low / close | OHLC + time |
volume / turnover | Size |
takerBuyVolume / openInterest / fundingRate | Crypto extras |
hl2 / hlc3 / ohlc4 | Composites |
Math (@tradescript/pro/sdk/indicators/math)
When to use: element-wise arithmetic and logic across whole series — combining bands, building conditions, avoiding hand-written loops.
Arithmetic
add, sub, mul, div, abs, neg, pow, sqrt, log, log10, exp, sign, floor, ceil, round
Aggregates
max2, min2, max(...), min(...), avg(...)
Trig
sin, cos, tan, asin, acos, atan
Comparisons / conditionals
eq, neq, gt, ge, lt, le, isZero, toBool, iff
Utility
last — read the most recent value of any series (for alerts, logging, labels).
Root package re-exports common math helpers for short demos; prefer the /math subpath in production code.
TA (@tradescript/pro/sdk/indicators/ta)
When to use: classic technical analysis over whole series — smoothing, momentum, volatility, volume flow, extremes, and signal crossings. Prefer these over manual loops; they handle warm-up windows consistently.
Moving averages
Smooth a series or build a trend baseline.
sma, ema, rma, wma, vwma, swma, alma
Volatility
Size moves, stops, and band widths.
stdev, variance, dev, tr, atr
Oscillators / stats
Momentum, mean reversion, and statistical relationships.
rsi, stoch, percentrank, correlation, linreg, sar, dmi, tsi, cci, mfi, willr, macd, bbands, supertrend
Volume / price
Flow and volume-weighted baselines.
accdist, obv, vwap, sessionVwap, mom
Pivots
Local swing highs and lows.
pivothigh, pivotlow
Series ops
Windows, extremes, accumulation, and change over time.
highest, lowest, highestbars, lowestbars, change, roc, cum, sum, offset, rising, falling
Crosses
Turn two series into entry/exit signals.
crossover, crossunder, cross
Both arguments must be series. For a constant level, map a flat series first:
const level = rsi.map(() => 70)
const overbought = ta.crossunder(rsi, level)
NaN helpers
Deal with warm-up gaps before plotting or comparing.
na, nz, fixnan
Calendar (UTC from time)
Branch on time-of-day, day-of-week, or seasonality.
year, month, dayofmonth, dayofweek, hour, minute, second, weekofyear
Warm-up positions are NaN for numeric series and false for boolean signals.
Authoring surface (root package)
When to use: everything that is not a calculation — declaring the indicator, its inputs, outputs, secondary symbols, and runtime context.
| Group | APIs |
|---|---|
| Factory | indicator, builtIn, isBuiltInIndicatorReference |
| Inputs | input.int / number / bool / source / color / select / text / symbol |
| Plots | See Indicator language — Plots |
| Outputs | marker, alert, draw |
| Multi-series | security, listSecurities |
| Context | runtime, period, interval, ticker, tickerid, isintraday, isdaily, isweekly, ismonthly, isdwm |
| Errors | error(message) → IndicatorError |
TypeScript support
The published types cover plot kinds, shapes, security map modes, context helpers, and every function listed on this page.
Related pages
- Indicator Language — the authoring API these helpers are called from.
- Custom Indicator Recipes — worked indicators using the helpers above.
- Write a Custom Indicator — define, register, add, and verify an indicator.