Indicator Settings
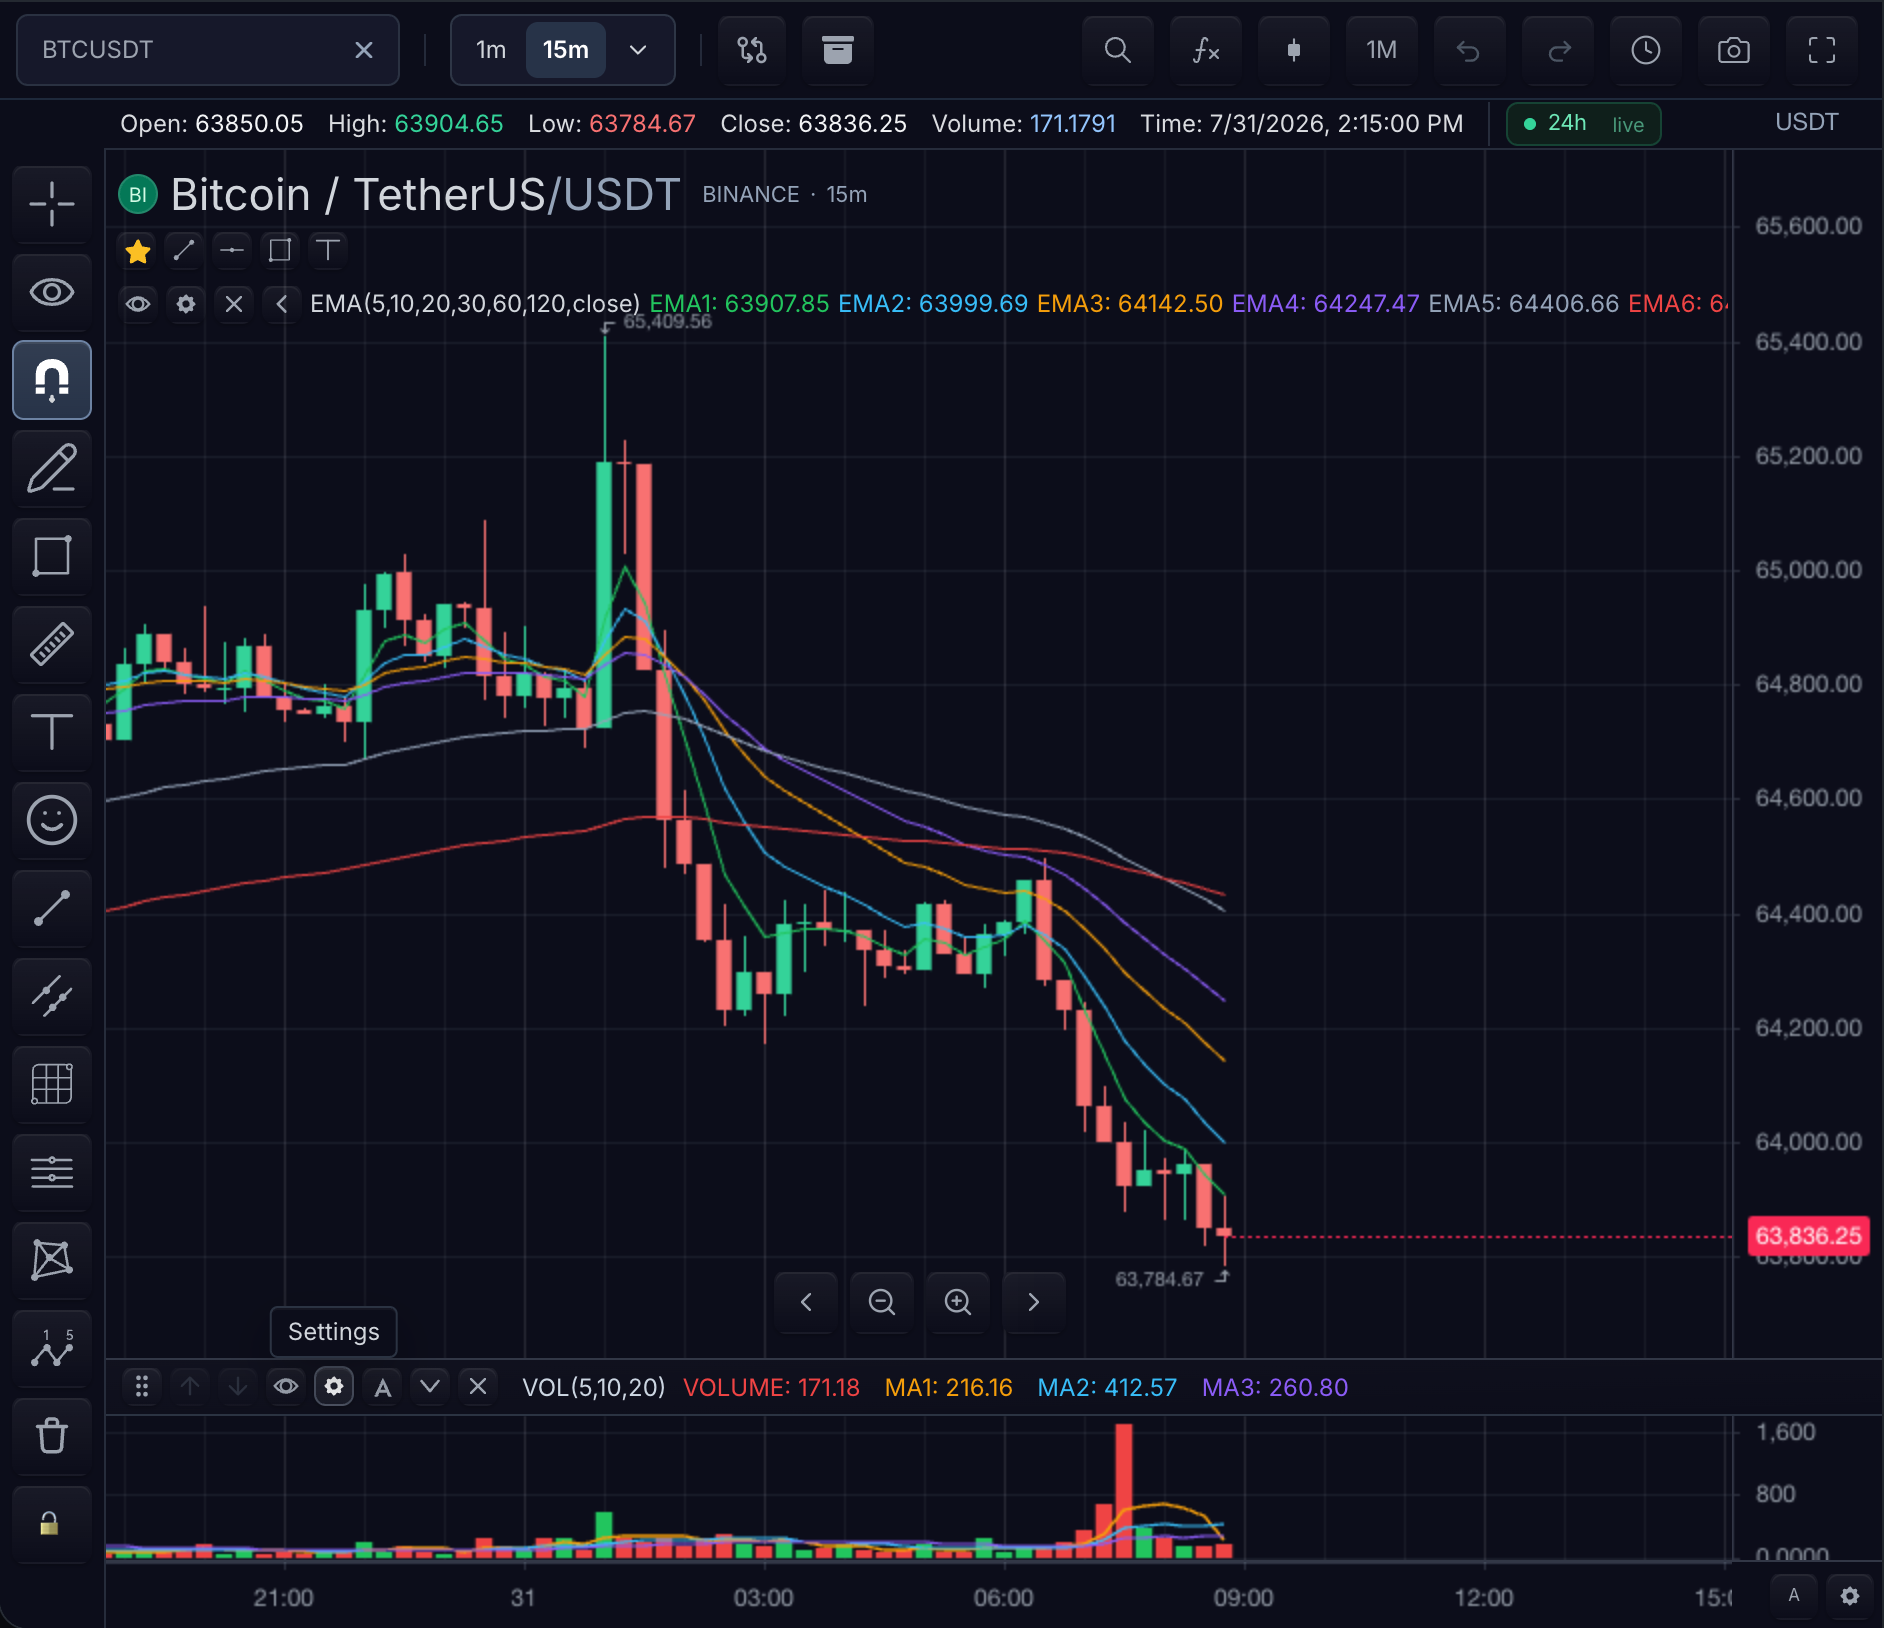
Five sources can set the same indicator input or style: indicator defaults, application defaults, the options passed when the instance is added, runtime updates, and per-bar colors. Only one wins a contested field, and only some of them survive a reload.
Which value wins
The sources below are ordered from lowest to highest priority. A later source overrides the same key from any earlier source.
- Indicator or catalog defaults — defaults declared by the indicator, including
input.*,plot.*, and built-in catalog defaults. - Application defaults for future indicators —
setBuiltInIndicatorDefaultsorsetIndicatorDefaults. - Options supplied while adding an indicator — inputs and styles passed to
addIndicatororaddBuiltInIndicator. - Changes to an existing indicator —
updateIndicator,updateBuiltInIndicatorProperties, or an indicator handle'supdateProperties. - Per-bar colors declared by the indicator —
plot.colorsandplot.barcolor; these paint over static styles for their individual bars.
Worked example — every layer sets EMA length or line width:
const ui = chart.customization()

// Application defaults for every EMA added after this call
ui.setBuiltInIndicatorDefaults('EMA', {
  inputs: { length: 21 },
  styles: { line: { color: '#38bdf8', width: 2 } },
})

// Add options win over the defaults
const id = chart.addBuiltInIndicator('EMA', {
  inputs: { length: 50 },         // wins over the default 21
  styles: { line: { width: 4 } }, // wins over the default 2; color stays #38bdf8
})

// An instance update wins over everything set at add time
chart.updateIndicator(id, { inputs: { length: 100 } }) // final length: 100
Defaults apply only to indicators created after the call. Existing instances keep their current state until you update them directly.
Persistence — settings survive reload
Instance state (inputs, styles, visibility, pane placement, axisLabelVisible) lives on the indicator instance and serializes into ChartState.indicators via getState() / setState(), alongside drawings and alerts. A user's Settings-dialog edits are instance state, so they survive reload whenever the host persists and restores chart state.
Verify the round-trip:
chart.updateIndicator(id, { inputs: { length: 50 } })  // simulate a user edit
const saved = chart.getState()

// ... new session: recreate the widget, then restore ...
chart.setState(saved)
chart.getIndicators().find((i) => i.id === id)?.inputs // → includes { length: 50 }
Application defaults for future indicators are chart customization state, not instance state — re-apply them at startup or persist them with your customization handling.
Initial defaults
Authoring inputs (indicator side)
input.int('Length', 14, {
  id: 'length',
  min: 1,
  max: 500,
  group: 'Params',
  tooltip: 'Lookback bars',
})
- Integer —
input.int - Float —
input.number - Boolean —
input.bool - Series source —
input.source - Color —
input.color - Enum —
input.select - Text —
input.text - Symbol —
input.symbol
Always set id. Optional group / tooltip feed Settings chrome. Author plot options (plot.line(..., { color, width, style })) become the chart's default visual settings.
Application defaults for future instances
| Layer | How |
|---|---|
| Author defaults | plot.line(..., { color, width, style }) |
| Future built-in indicator defaults | chart.customization().setBuiltInIndicatorDefaults(id, { inputs, styles, paneId, paneHeight, visible, priceScale }) |
| Future custom indicator defaults | chart.customization().setIndicatorDefaults(name, { inputs, styles, paneId, paneHeight, visible, priceScale }) |
| Global overrides | chart.customization().applyStyleOverrides({ indicators: … }) |
Use setBuiltInIndicatorDefaults(id, defaults) for future built-in indicators. Use inspectBuiltInIndicatorDefaults(id, defaults) when a Settings UI needs feedback before submitting defaults. Unknown input ids, invalid values, unknown style ids, invalid pane heights, invalid price-scale placements, and non-boolean visibility values are reported as diagnostics. Custom indicator names can define their own inputs and styles through setIndicatorDefaults(...).
For built-in indicators, use the Built-in Indicator Reference for exact inputs.* and styles.* paths.
Runtime changes
The definition you patch
When you call addIndicator / updateIndicator:
export interface IndicatorDefinition {
  id?: string
  name: string
  paneId?: string
  paneHeight?: number
  priceScale?: 'as-series' | 'new-left' | 'new-right' | 'no-scale'
  visible?: boolean
  axisLabelVisible?: boolean         // plot values on the price axis
  inputs?: Record<string, unknown>   // by input id / key
  styles?: Record<string, unknown>
  securities?: Record<string, SecuritySeries>
}
Inputs
Keys match authoring id:
// Indicator:
input.int('Length', 14, { id: 'length' })

// Host:
chart.addIndicator({ name, inputs: { length: 21 } })
chart.updateIndicator(id, { inputs: { length: 50 } })
Use an object keyed by the input ids you declared. This keeps settings readable and stable when you add or reorder inputs.
Styles on existing instances
| Instance kind | How |
|---|---|
| Existing built-in instance | updateBuiltInIndicatorProperties(id, { styles }) or getIndicatorHandle(id)?.updateProperties({ styles }) |
| Existing custom instance | updateIndicator(id, { styles }) when your UI exposes them |
| Per-bar colors | plot.colors / plot.barcolor in the indicator |
updateBuiltInIndicatorProperties(instanceId, patch) and updateProperties(patch) validate catalog-backed inputs and styles before mutating the live indicator. Use inspectBuiltInIndicatorProperties(id, patch) when a settings UI needs diagnostics before submitting an existing built-in property patch.
Price-axis labels
Every indicator can show its latest plot values as labels on the price axis. The chart-wide default lives in chart styles (indicator.lastValueMark.show, exposed in chart settings as Show indicator values on price axis); axisLabelVisible pins one indicator either way.
chart.updateIndicator(id, { axisLabelVisible: false })            // this indicator only, labels off
chart.getIndicatorHandle(id)?.updateProperties({ axisLabelVisible: true })
| Value | Behavior |
|---|---|
undefined | Follows the chart-wide default |
true | Labels on for this indicator, whatever the default is |
false | Labels off for this indicator, whatever the default is |
The chart settings dialog lists one switch per indicator under Price Axis → Indicator axis labels, and the indicator Settings dialog carries the same switch under Visibility. Both update the same instance setting, so a pinned preference survives later chart-settings changes.
Saved state
Settings dialog (UI)
For each indicator instance, Settings typically shows:
| Tab / area | Source of fields |
|---|---|
| Inputs | Authored input.* declarations |
| Style | Authored plot.* declarations and instance style overrides |
| Visibility | Instance visible, plot visible, axisLabelVisible |
TradeScript owns the Settings schema. Your integration updates instance values through chart.updateIndicator; those values round-trip through getState() and setState().
Use clearIndicatorDefaults(name) to remove future defaults for one indicator, or clearIndicatorDefaults() to clear the full default map. Clearing defaults does not touch existing instances — they keep their saved values.
Result keys (calc map)
Plots and markers should set key when hosts or tests read values:
plot.line(fast, { key: 'fast', title: 'Fast EMA' })
marker(up, { dir: 'up', key: 'golden', label: 'Golden' })
plot.value(score, { key: 'score' }) // hidden series
Without key, TradeScript assigns one automatically. Set a key whenever your application needs to read or style a specific result.
Indicator errors in Settings
If error('message') stops a calculation, surface that message in Settings, the legend, or a toast.
Related pages
- Built-in Indicator Reference — every built-in indicator's inputs, styles, and override paths.
- Indicator Language: inputs — declaring the inputs a user can change.
- Write a Custom Indicator — the authoring lifecycle behind author defaults.