Indicator Language
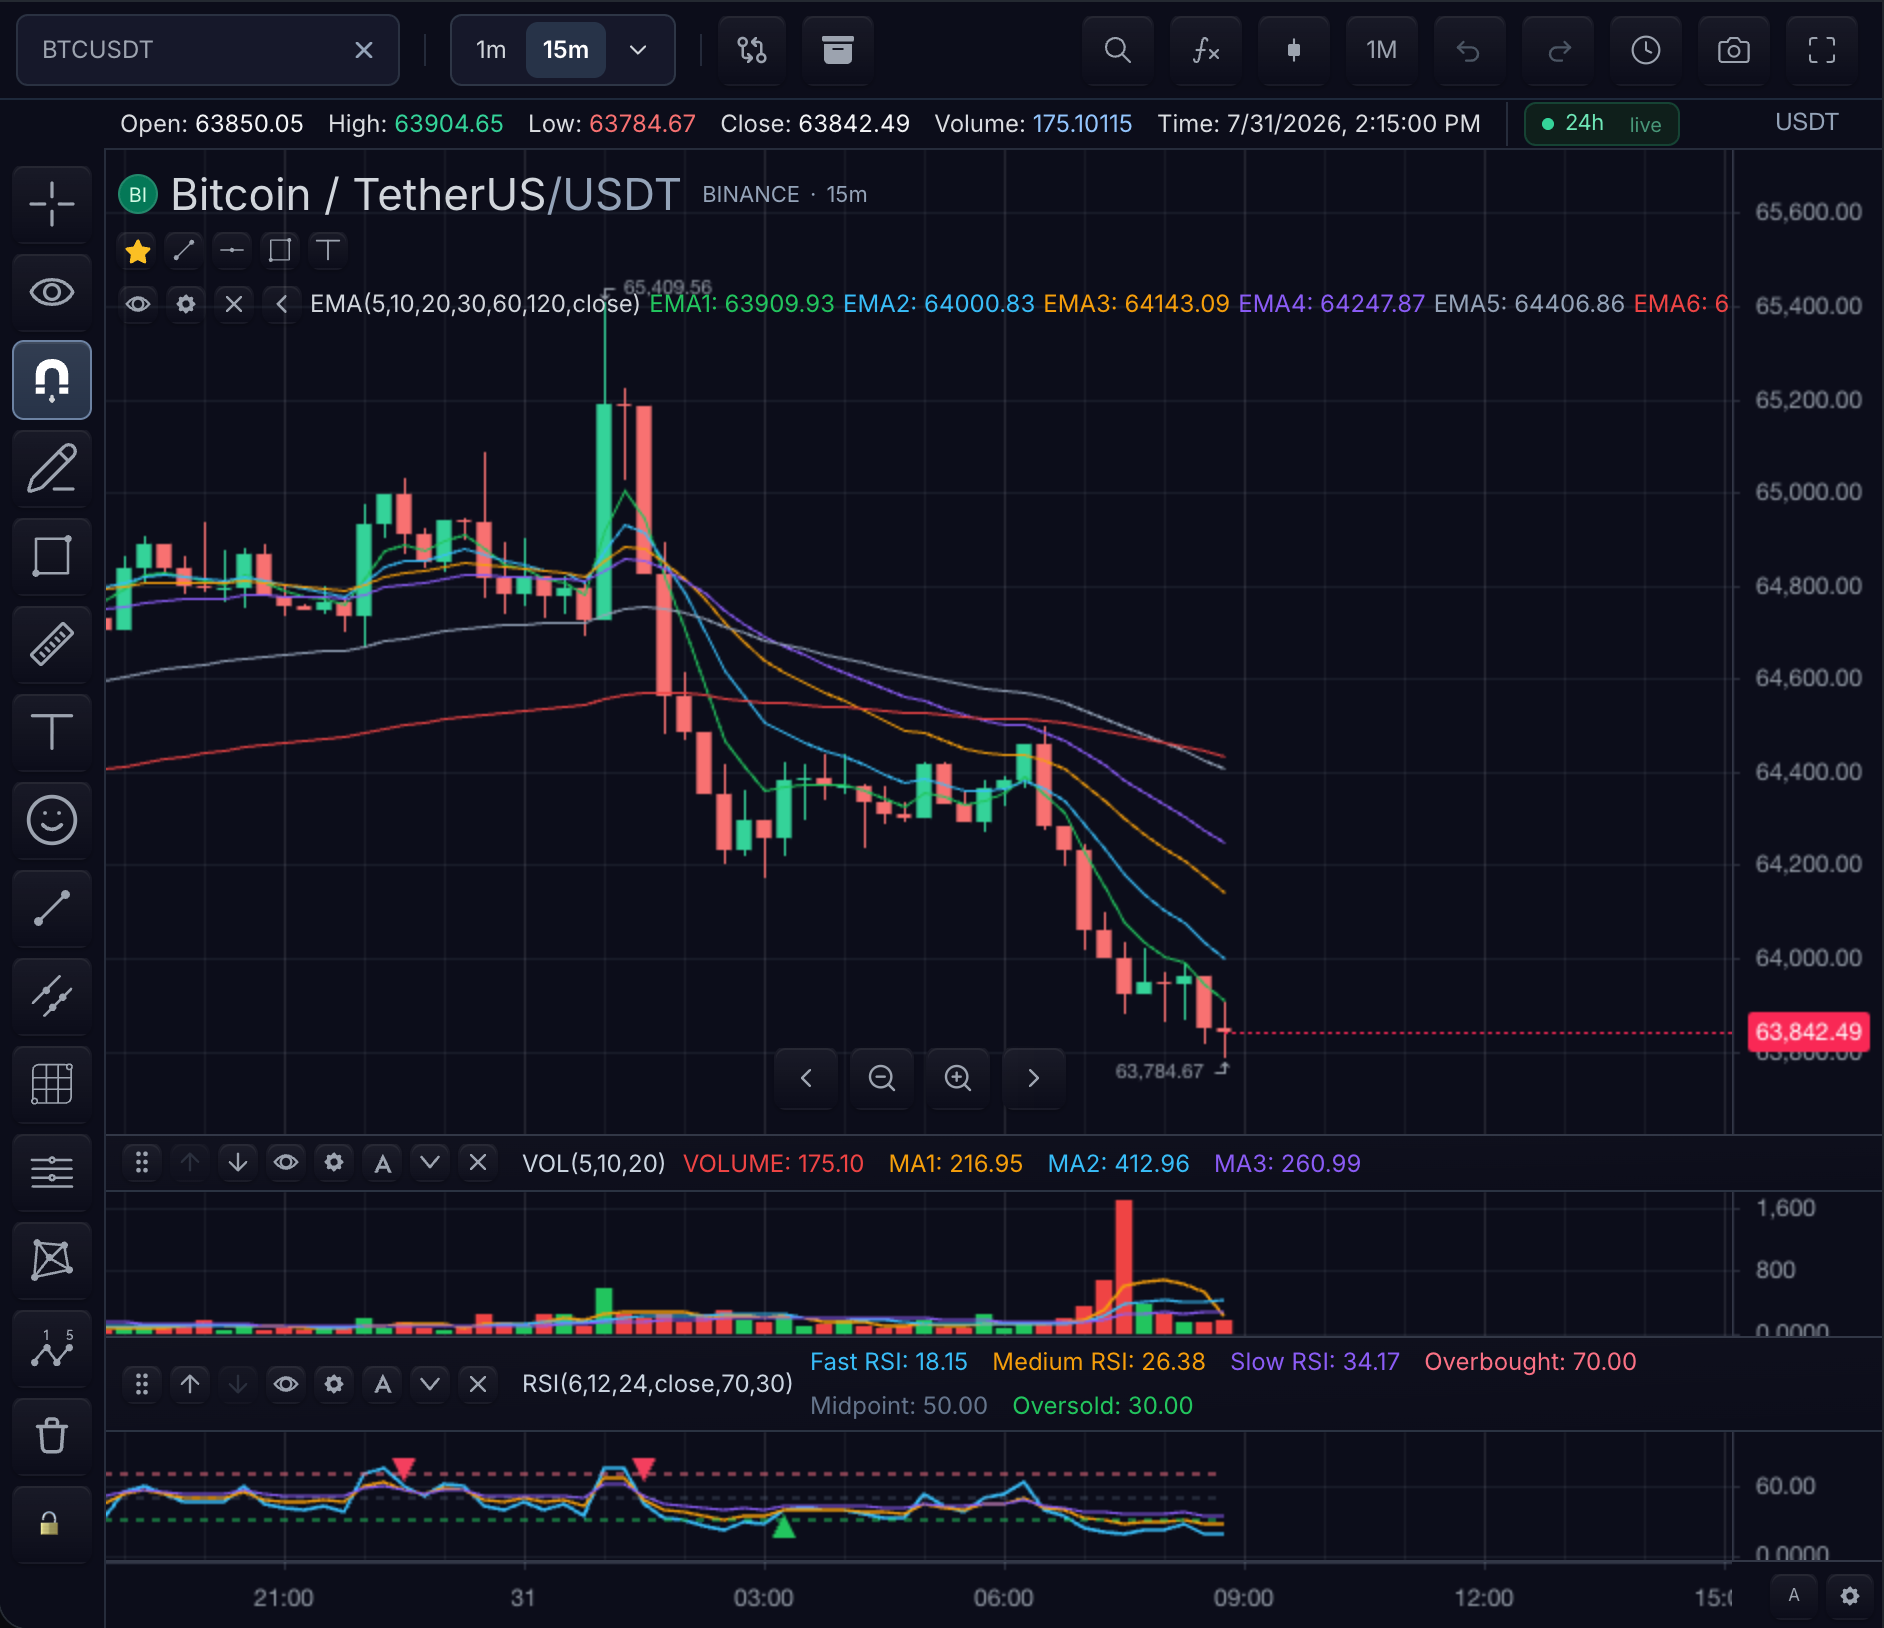
Custom indicators are TypeScript modules that call a small authoring API. Add the module to your application, register it during startup, and add it to any chart that needs the calculation.
- TypeScript indicators live under
@tradescript/pro/sdk/indicators. - The application TradeScript language used for strategies and backtests is a separate product surface.
Mental model
Before any syntax, six facts explain how every indicator behaves:
- One default export —
export default indicator(name, body, options). The module is the indicator. - The body re-runs on every calc — new bars, input changes, and reloads all re-execute it. Never cache market series between runs.
- Series are plain arrays —
close,high, ... are full-length numeric arrays for the current bars. Preferta.*over whole series;forloops are allowed for state machines. - Inputs declare the Settings schema — each
input.*call returns the current value and adds a Settings field. Set values by inputid. - Outputs are registered by calling —
plot.*,marker,alert, and drawing-command calls during the body define what renders. No return value. - Your application supplies external data — load secondary-symbol bars, pass them as
securitieswhen adding or updating the indicator, and read them withsecurity(...). Keep indicator bodies synchronous and data-oriented.
What the language supports
| Area | APIs | Notes |
|---|---|---|
| Inputs / Settings | input.int number bool source color select text symbol | Inputs — always set a stable id |
| Plots | plot.line stepline histogram points area band fill hline ohlc shapes chars arrows bgcolor barcolor colorer value | Plots |
| Signal markers | marker(signal, options) | Markers, alerts, drawing commands |
| Indicator alerts | alert(name, condition, options) | Markers, alerts, drawing commands |
| Chart-space drawing | drawLine, drawBox, drawBandFill, drawLabel, profile recipes | Markers, alerts, drawing commands |
| Multi-symbol | security(symbol, field?, { map }), listSecurities | Use secondary market data |
| Future timestamps | plot timestamps + canExtendTimeScale | Future timestamps |
| Context | runtime, period, interval, ticker, tickerid, isintraday, ... | Context helpers |
| Errors / logging | error(message), console.* | Errors, Debug logging |
| Helper library | ta.*, math helpers | Formal reference: TypeScript stdlib |
Imports
| Import | Purpose |
|---|---|
@tradescript/pro/sdk/indicators | indicator, input, plot, marker, alert, serializable drawLine / drawBox / drawBandFill / drawLabel, market series, security, context helpers |
@tradescript/pro/sdk/indicators/ta | Technical analysis (sma, rsi, …) |
@tradescript/pro/sdk/indicators/math | Series math (add, mul, iff, …) |
Use these imports in the custom indicator module that your application registers.
Anatomy of an indicator
import { indicator, input, plot, close } from '@tradescript/pro/sdk/indicators'
import * as ta from '@tradescript/pro/sdk/indicators/ta'

export default indicator(
  'Display name',           // 1. name
  () => {                   // 2. body — runs each calc
    const length = input.int('Length', 14, { id: 'length', min: 1 })
    plot.line(ta.sma(close, length), { key: 'sma', title: 'SMA' })
  },
  { pane: 'price' },        // 3. options
)
Indicator options
The common choices are pane, a stable id, and compactLabel:
pane | Result |
|---|---|
'price' | Overlay on the main series |
'separate' | New pane (default) |
'volume' | Volume-style pane |
Full options object
indicator('Name', body, {
  pane: 'price' | 'separate' | 'volume', // default 'separate'
  id: 'stable-id',                       // persistence / object tree
  compactLabel: 'N',                        // legend / price scale
  description: 'Longer help text',
  precision: 2,
  minValue: 0,
  maxValue: 100,
  shouldOhlc: false,
  format: { type: 'price', precision: 2 }, // or inherit / volume / percent / number
  hidden: false,                           // hide from Indicators dialog
  linkedToSeries: true,                    // share main price scale
  canExtendTimeScale: false,               // allow explicit/right-side time-domain slots
})
TradeScript derives the built-in Settings and Object Tree presentation from these options and input declarations.
Inputs
Always set a stable id so saved layouts survive label renames.
input.int('Length', 14, { id: 'length', min: 1, max: 500, group: 'Params', tooltip: 'Lookback' })
input.number('Mult', 2, { id: 'mult', step: 0.1 })
input.bool('Show band', true, { id: 'show' })
input.source('Source', 'close', { id: 'source' })
input.color('Color', '#22c55e', { id: 'color' })
input.select('Mode', ['A', 'B'] as const, 'A', { id: 'mode' })
input.text('Label', '', { id: 'label' })
input.symbol('Other', 'ETHUSDT', { id: 'other', group: 'Data' })
Object form:
input.int({ id: 'length', label: 'Length', default: 14, min: 1, group: 'Params' })
| Kind | API | Settings type |
|---|---|---|
| Integer | input.int | number |
| Float | input.number | number |
| Boolean | input.bool | boolean |
| OHLC source | input.source | series field |
| Color | input.color | CSS color |
| Enum | input.select | string from list |
| Free text | input.text | string |
| Symbol | input.symbol | ticker for a secondary market-data series |
Set input values through Settings.
Plots
Plot APIs
| Call | Visual |
|---|---|
plot.line(values, o?) | Continuous line |
plot.stepline(values, o?) | Step / ladder line |
plot.histogram(values, o?) | Columns |
plot.points(values, o?) | Circles |
plot.area(values, o?) | Area to baseline |
plot.band(upper, lower, o?) | Channel + fill |
plot.fill(upper, lower, o?) | Fill between two series |
plot.hline(level, o?) | Horizontal level |
plot.ohlc({ open, high, low, close }, o?) | Candles or bars |
plot.shapes(values, o?) | Shape markers where value is finite/non-zero |
plot.chars(values, { char, … }) | Character markers |
plot.arrows(values, o?) | Up if > 0, down if < 0 |
plot.bgcolor(colors, o?) | Pane background per bar |
plot.barcolor(colors, o?) | Main candle body colors |
plot.colorer(values, { target, … }) | Discrete colorer for a plot key |
plot.value(values, { key }) | Hidden series for hosts/tests |
Style options
Common fields: key (stable result / figure id), title, color, width, visible.
All style options
{
  key?: string              // stable result / figure id
  title?: string
  color?: string
  colors?: ColorSeries      // per-bar
  width?: number
  style?: 'solid' | 'dashed' | 'dotted'
  baseValue?: number
  fillColor?: string
  fillOpacity?: number      // 0–1
  offset?: number
  visible?: boolean
  // OHLC
  ohlcStyle?: 'candles' | 'bars'
  upColor?: string
  downColor?: string
  wickColor?: string
  borderColor?: string
  // shapes / chars
  shape?: ShapePlotType
  location?: ShapeLocation  // AboveBar | BelowBar | Top | Bottom | Absolute | …
  size?: ShapeSize          // tiny | small | normal | large | huge
  char?: string
  text?: string
  textColor?: string
}
Examples
// Channel
plot.band(upper, lower, { color: '#8b5cf6', fillOpacity: 0.12, key: 'channel' })

// Fill only
plot.fill(upper, lower, { fillColor: 'rgba(139,92,246,0.12)' })

// Shapes on signals (boolean or 0/1 series)
plot.shapes(breakout, {
  shape: 'shape_triangle_up',
  location: 'BelowBar',
  color: '#22c55e',
  size: 'small',
})

// Color main bars by bias
plot.barcolor(close.map((c, i) =>
  Number.isFinite(ema[i]) && c >= ema[i] ? '#22c55e' : '#ef4444'
))

// Scores without drawing
plot.value(score, { key: 'score' })
Markers, alerts, drawing commands
import { drawBandFill, drawBox, drawLabel, drawLine } from '@tradescript/pro/sdk/indicators'

marker(signal, {
  dir: 'up' | 'down',
  color: '#22c55e',
  label: 'Break',
  key: 'breakUp',
  price: low,           // optional absolute price series
  shape: 'shape_circle',
  size: 'normal',
})

alert('Overbought', () => last(rsi) > 70, {
  message: () => `RSI ${last(rsi).toFixed(1)}`,
  severity: 'warning',  // info | warning | critical
})

drawLine({ fromIndex: 0, fromPrice: 100, toIndex: 10, toPrice: 110, color: '#94a3b8' })
drawBox({ fromIndex: 0, toIndex: 5, top: 120, bottom: 100, fill: 'rgba(34,197,94,0.08)' })
drawBandFill({ upper, lower, fill: 'rgba(139,92,246,0.12)' })
drawLabel('Hi', { index: 3, price: high[3], color: '#38bdf8' })
Use these drawing calls to place lines, boxes, filled bands, and labels on the chart. The profile recipes are drawVisibleRangeVolumeProfile, drawSessionVolumeProfile, and drawMarketProfile.
Use draw((scene) => ...) only when you need the scene helpers it provides. Prefer the specific drawing calls above for new indicators because their inputs are easier to inspect, test, and persist.
Multi-symbol: security
Indicators read secondary bars that your application passes through the typed securities option.
const other = input.symbol('Other', 'ETHUSDT', { id: 'other' })

// exact timestamps only (missing → NaN)
plot.line(security(other, 'close'), { key: 'other' })

// last secondary bar at or before the main-series time
plot.line(security(other, 'close', { map: 'continuous' }), { key: 'other_c' })
Field defaults to 'close'. Setup: Use secondary market data.
Future timestamps
Indicators that opt into time-scale extension can publish plot values at explicit timestamps:
indicator('Projection', () => {
  plot.line([101, 102], {
    key: 'projection',
    timestamps: [Date.UTC(2026, 0, 2), Date.UTC(2026, 0, 3)],
  })
}, { pane: 'price', canExtendTimeScale: true })
The chart reserves those timestamps on the right side of the time scale without adding synthetic OHLC bars. Plots without timestamps remain aligned to the main chart bars.
Context helpers
runtime()            // id, securities, budgets, symbol, resolution, …
period() / interval()
ticker() / tickerid()
isintraday() / isdaily() / isweekly() / ismonthly() / isdwm()
listSecurities()
Errors
import { error } from '@tradescript/pro/sdk/indicators'

if (close.length < length) error('Not enough history')
- Throws
Errorwithname === 'IndicatorError' - Your application can surface the message in its Settings UI, legend, or logs
Debug logging
console.log('last', last(value))
console.warn('overbought')
Use your application's normal development console while testing an indicator. Do not rely on console output as part of the indicator result.
Built-in references
Use chart.addBuiltInIndicator(id) to add a built-in indicator. See Built-in indicators for catalog ids and configuration.
Keep calculations focused
Keep an indicator synchronous and data-oriented. Read the supplied series, calculate the values, and emit plots, markers, alerts, or drawing commands. Load any external market data in your application and pass it through the multi-symbol integration.
Related pages
- TypeScript Stdlib — the full
ta.*and math helper list, organized by task. - Built-in Indicator Reference — every built-in id, input, and style path.
- Write a Custom Indicator — define, register, add, and verify an indicator.