Custom Indicator Recipes
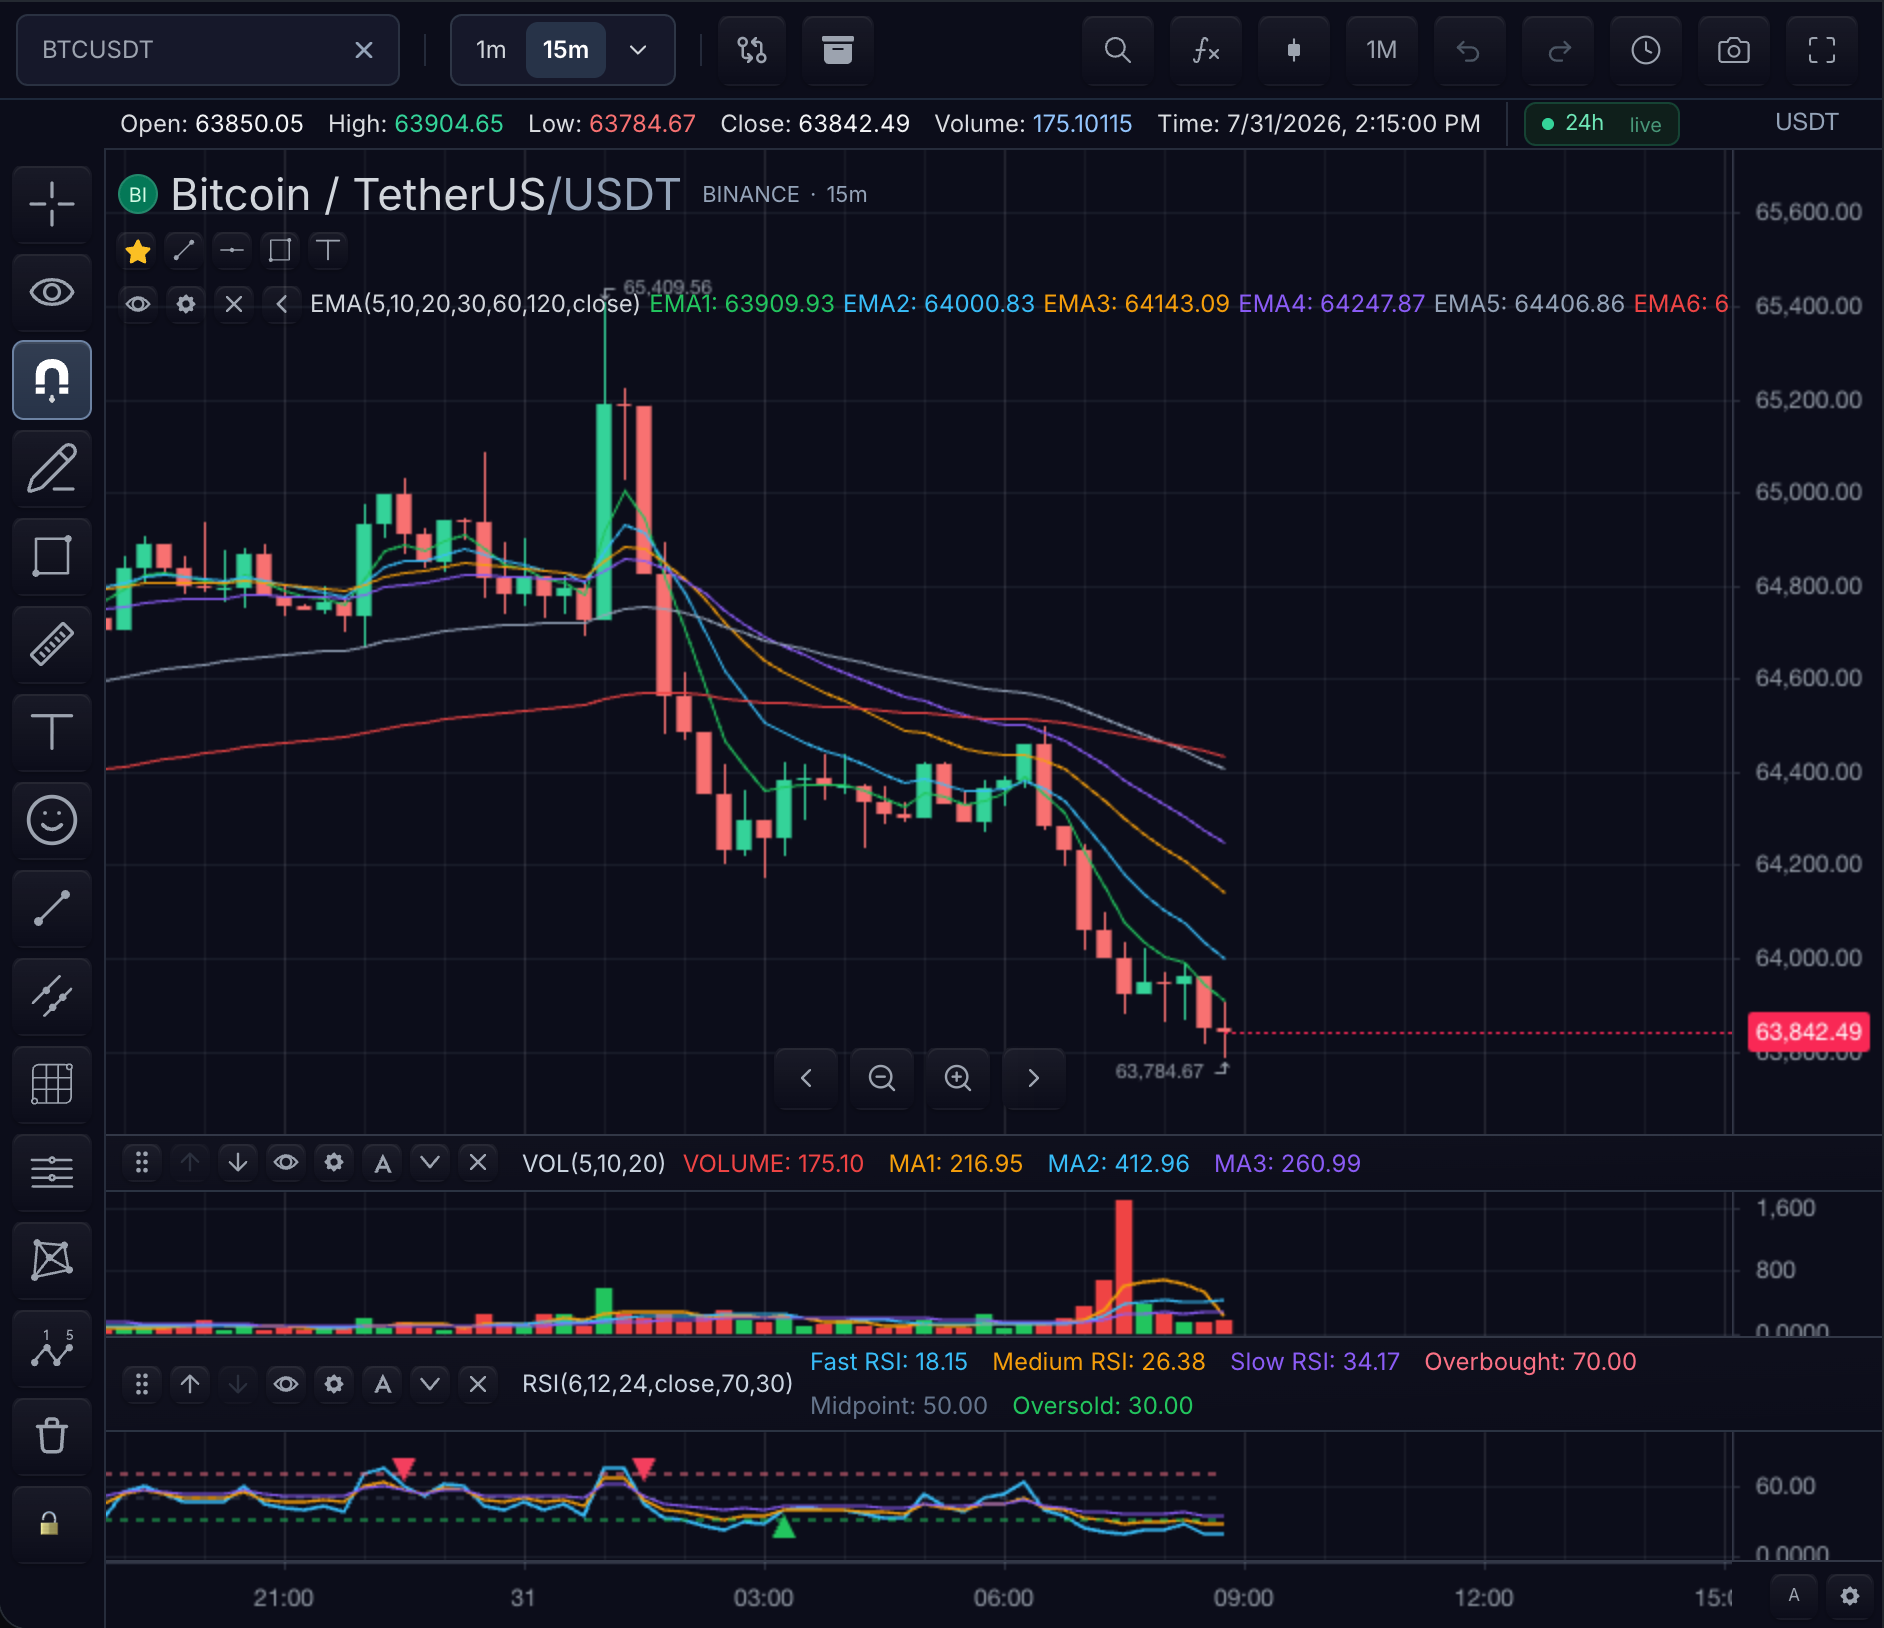
Each recipe below covers one common custom-indicator pattern. It opens with the chart result it produces, states its difficulty and the APIs it uses, walks the few lines that matter, and keeps the complete module in a collapsed block.
Every complete source is a full export default indicator(...) module. Compile and register as in Getting started.
Draw a moving-average line
What you get: a single blue moving-average line drawn over the candles on the main price pane, with Length and Source fields in the indicator's Settings dialog.
- Difficulty: beginner
- APIs used:
input.int,input.source,ta.sma,plot.line
Steps:
-
Declare the inputs that Settings should expose:
const length = input.int('Length', 9, { id: 'length', min: 1 })const source = input.source('Source', 'close', { id: 'source' }) -
Compute and plot the series:
plot.line(ta.sma(source, length), { key: 'ma', title: 'MA', color: '#2196F3', width: 2 }) -
Pass
{ pane: 'price' }in the options so the line overlays the main series.
Complete source
import { indicator, input, plot, close } from '@tradescript/pro/sdk/indicators'
import * as ta from '@tradescript/pro/sdk/indicators/ta'
export default indicator('Moving Average', () => {
const length = input.int('Length', 9, { id: 'length', min: 1 })
const source = input.source('Source', 'close', { id: 'source' })
plot.line(ta.sma(source, length), {
key: 'ma',
title: 'MA',
color: '#2196F3',
width: 2,
})
}, { pane: 'price', compactLabel: 'MA' })
Color the candles by trend
What you get: the main candles repaint teal while price closes above its EMA and red while below, with a grey EMA reference line and both colors editable in Settings.
- Difficulty: beginner
- APIs used:
input.color,ta.ema,plot.line,plot.barcolor
Steps:
-
Expose the two state colors as inputs (
input.color) so users can restyle them. -
Compute the EMA and plot it as a reference line.
-
Map each bar to a color — return
undefinedduring warm-up so those candles keep their normal paint:plot.barcolor(close.map((c, i) => {if (!Number.isFinite(ema[i])) return undefinedreturn c >= ema[i] ? up : down}))
Related: plot.bgcolor paints pane background stripes with the same per-bar color mechanics.
Complete source
import { indicator, input, plot, close } from '@tradescript/pro/sdk/indicators'
import * as ta from '@tradescript/pro/sdk/indicators/ta'
export default indicator('Bar Color vs EMA', () => {
const length = input.int('EMA Length', 20, { id: 'length', min: 1 })
const up = input.color('Up color', '#26a69a', { id: 'up' })
const down = input.color('Down color', '#ef5350', { id: 'down' })
const ema = ta.ema(close, length)
plot.line(ema, { key: 'ema', title: 'EMA', color: '#787B86' })
plot.barcolor(close.map((c, i) => {
  if (!Number.isFinite(ema[i])) return undefined
  return c >= ema[i] ? up : down
}))
}, { pane: 'price' })
Recolor one plot point by point
What you get: an RSI line in its own pane that turns red above 70 and teal below 30, with dashed threshold lines at both levels and the pane clamped to a 0–100 range.
- Difficulty: beginner
- APIs used:
ta.rsi,plot.linewithcolors,plot.hline
Steps:
-
Compute the oscillator:
const value = ta.rsi(close, 14). -
Build a per-point color array (one entry per bar,
undefinedfor warm-up):const colors = value.map(v =>!Number.isFinite(v) ? undefined : v > 70 ? '#ef5350' : v < 30 ? '#26a69a' : '#7E57C2',) -
Pass it as
colorsnext to the basecolor, and addplot.hline(70)/plot.hline(30)levels. -
Use
{ pane: 'separate', minValue: 0, maxValue: 100 }so the pane scale stays fixed.
Complete source
import { indicator, plot, close } from '@tradescript/pro/sdk/indicators'
import * as ta from '@tradescript/pro/sdk/indicators/ta'
export default indicator('RSI with per-bar color', () => {
const value = ta.rsi(close, 14)
const colors = value.map(v =>
  !Number.isFinite(v) ? undefined : v > 70 ? '#ef5350' : v < 30 ? '#26a69a' : '#7E57C2',
)
plot.line(value, { key: 'rsi', title: 'RSI', color: '#7E57C2', colors })
plot.hline(70, { color: '#ef5350', style: 'dashed' })
plot.hline(30, { color: '#26a69a', style: 'dashed' })
}, { pane: 'separate', precision: 2, minValue: 0, maxValue: 100 })
Fill the area between two series
What you get: Bollinger Bands on the price pane — a grey basis line with a translucent blue channel filled between the upper and lower bands, and Length / Mult inputs in Settings.
- Difficulty: intermediate
- APIs used:
ta.sma,ta.stdev, math helpers (add,sub,mul),plot.band(orplot.fill)
Steps:
-
Compute basis and deviation with the math helpers:
const basis = ta.sma(close, length)const dev = mul(ta.stdev(close, length), mult) -
Derive
upper = add(basis, dev)andlower = sub(basis, dev). -
Plot the basis line, then the channel:
plot.band(upper, lower, { key: 'bb', title: 'Bands', color: '#2196F3', fillOpacity: 0.12 })Use
plot.fill(upper, lower, { fillColor: ... })instead when you want only the fill without band outlines.
Complete source
import { indicator, input, plot, close } from '@tradescript/pro/sdk/indicators'
import * as ta from '@tradescript/pro/sdk/indicators/ta'
import { add, sub, mul } from '@tradescript/pro/sdk/indicators/math'
export default indicator('Bollinger Bands', () => {
const length = input.int('Length', 20, { id: 'length', min: 1 })
const mult = input.number('Mult', 2, { id: 'mult', step: 0.1 })
const basis = ta.sma(close, length)
const dev = mul(ta.stdev(close, length), mult)
const upper = add(basis, dev)
const lower = sub(basis, dev)
plot.line(basis, { key: 'basis', title: 'Basis', color: '#787B86' })
plot.band(upper, lower, {
key: 'bb',
title: 'Bands',
color: '#2196F3',
fillOpacity: 0.12,
})
// or: plot.fill(upper, lower, { fillColor: 'rgba(33,150,243,0.12)' })
}, { pane: 'price' })
Mark signals with shapes, characters, and markers
What you get: teal triangles under bars where price crosses above its moving average, red × characters above bars on cross-downs, and an equivalent marker() variant when your application needs to read signals by key.
- Difficulty: intermediate
- APIs used:
ta.crossover,ta.crossunder,plot.shapes,plot.chars,marker
Steps:
-
Build boolean signal series:
const up = ta.crossover(close, ma)andconst dn = ta.crossunder(close, ma). -
Render shapes where the signal is true:
plot.shapes(up, { shape: 'shape_triangle_up', location: 'BelowBar', color: '#26a69a', size: 'small' })plot.chars(dn, { char: '×', location: 'AboveBar', color: '#ef5350', textColor: '#ef5350' }) -
Alternatively use
marker(up, { dir: 'up', ... })when hosts or tests need to read the signal back bykey.
Complete source
import { indicator, plot, close, marker } from '@tradescript/pro/sdk/indicators'
import * as ta from '@tradescript/pro/sdk/indicators/ta'

export default indicator('Shapes demo', () => {
  const ma = ta.sma(close, 20)
  const up = ta.crossover(close, ma)
  const dn = ta.crossunder(close, ma)

  plot.line(ma, { key: 'ma', color: '#787B86' })
  plot.shapes(up, {
    shape: 'shape_triangle_up',
    location: 'BelowBar',
    color: '#26a69a',
    size: 'small',
  })
  plot.chars(dn, { char: '×', location: 'AboveBar', color: '#ef5350', textColor: '#ef5350' })

  // Alternative: marker() API
  marker(up, { dir: 'up', color: '#26a69a', label: 'Up', key: 'up' })
}, { pane: 'price' })
Plot derived OHLC candles
What you get: a second candle series rendered in its own pane from series you compute — the pattern behind Heikin-Ashi-style transforms.
- Difficulty: intermediate
- APIs used:
plot.ohlc, market seriesopen/high/low/close
Steps:
-
Compute (or pass through) four aligned series for open, high, low, close.
-
Hand them to
plot.ohlcwith a candle or bar style:plot.ohlc({ open, high, low, close }, { ohlcStyle: 'candles', upColor: '#26a69a', downColor: '#ef5350' }) -
Set
shouldOhlc: truein the options so the pane scales for candle geometry.
Complete source
import { indicator, plot, open, high, low, close } from '@tradescript/pro/sdk/indicators'

export default indicator('Heikin-style OHLC', () => {
  // Example: plot raw OHLC; replace with your transformed series
  plot.ohlc(
    { open, high, low, close },
    {
      ohlcStyle: 'candles',
      upColor: '#26a69a',
      downColor: '#ef5350',
      title: 'OHLC',
    },
  )
}, { pane: 'separate', shouldOhlc: true })
Use a secondary indicator series
What you get: the main symbol's close plotted next to a second symbol's close on the same pane, with the second ticker editable through a Symbol input. Your application loads the secondary bars; the indicator only reads them.
- Difficulty: advanced
- APIs used:
input.symbol,security(indicator module);registerCustomIndicator,loadSecuritiesForIndicator(application integration)
Steps:
-
In the indicator, declare the symbol input and read the supplied series:
const other = input.symbol('Symbol', 'ETHUSDT', { id: 'other' })plot.line(security(other, 'close', { map: 'continuous' }), { key: 'other', title: 'Other' }) -
In your application, after registering, load the secondary series and pass them through
securities:const securities = await loadSecuritiesForIndicator(ci, mainBars, { other: 'ETHUSDT' }, loadBars)chart.addIndicator({ name, paneId: 'candle_pane', inputs: { other: 'ETHUSDT' }, securities }) -
Choose the map mode:
precise(exact timestamps, gaps becomeNaN) orcontinuous(carry the latest earlier bar forward).
Complete source
Indicator:
import { indicator, input, plot, close, security } from '@tradescript/pro/sdk/indicators'

export default indicator('Secondary close', () => {
  const other = input.symbol('Symbol', 'ETHUSDT', { id: 'other' })
  plot.line(close, { key: 'main', title: 'Main', color: '#26a69a' })
  plot.line(security(other, 'close', { map: 'continuous' }), {
    key: 'other',
    title: 'Other',
    color: '#2196F3',
  })
}, { pane: 'price' })
Application (after registration):
import { loadSecuritiesForIndicator, registerCustomIndicator } from '@tradescript/pro/sdk'

const name = registerCustomIndicator(ci)
const securities = await loadSecuritiesForIndicator(ci, mainBars, { other: 'ETHUSDT' }, loadBars)

chart.addIndicator({
  name,
  paneId: 'candle_pane',
  inputs: { other: 'ETHUSDT' },
  securities,
})
Full integration guide: Use secondary market data.
Log values while developing
What you get: bar count and the latest RSI value printed to the development console on every calc, next to a normal RSI plot — a quick way to confirm the indicator body runs and sees data.
- Difficulty: beginner
- APIs used:
console.log,last,ta.rsi,plot.line
Steps:
-
Compute the series you want to inspect.
-
Guard on data presence and log the latest value:
if (close.length > 0) {console.log('bars', close.length, 'rsi', last(rsi))} -
Remove or gate the logging before shipping — console output is not part of the indicator result.
Complete source
import { indicator, plot, close, last } from '@tradescript/pro/sdk/indicators'
import * as ta from '@tradescript/pro/sdk/indicators/ta'
export default indicator('Console demo', () => {
const rsi = ta.rsi(close, 14)
if (close.length > 0) {
  console.log('bars', close.length, 'rsi', last(rsi))
}
plot.line(rsi, { key: 'rsi', title: 'RSI' })
}, { pane: 'separate' })
Use your application logger while developing a custom indicator.
Fail fast on insufficient history
What you get: instead of a misleading partial plot, the indicator aborts with a readable message (surfaced through instance._indicatorError) whenever the loaded history is shorter than the configured lookback.
- Difficulty: beginner
- APIs used:
error,input.int,ta.sma
Steps:
-
Compare the available bar count against the configured length.
-
Call
error(...)with an actionable message:if (close.length > 0 && close.length < length) {error(`Need at least ${length} bars`)} -
Surface
instance._indicatorErrorin your Settings UI, legend, or a toast — see Settings.
Complete source
import { indicator, input, plot, close, error } from '@tradescript/pro/sdk/indicators'
import * as ta from '@tradescript/pro/sdk/indicators/ta'
export default indicator('Needs history', () => {
const length = input.int('Length', 200, { id: 'length', min: 1 })
if (close.length > 0 && close.length < length) {
  error(`Need at least ${length} bars`)
}
plot.line(ta.sma(close, length), { key: 'sma' })
}, { pane: 'price' })
Using these recipes
Copy the relevant pattern into a .ts module in your application, then register its exported definition during application startup.
Related pages
- Indicator Language — the authoring API these recipes call, concept by concept.
- TypeScript Stdlib — the moving averages, oscillators, and series math available inside an indicator.
- Write a Custom Indicator — the source, metadata, registration, and verification lifecycle.