Indicators
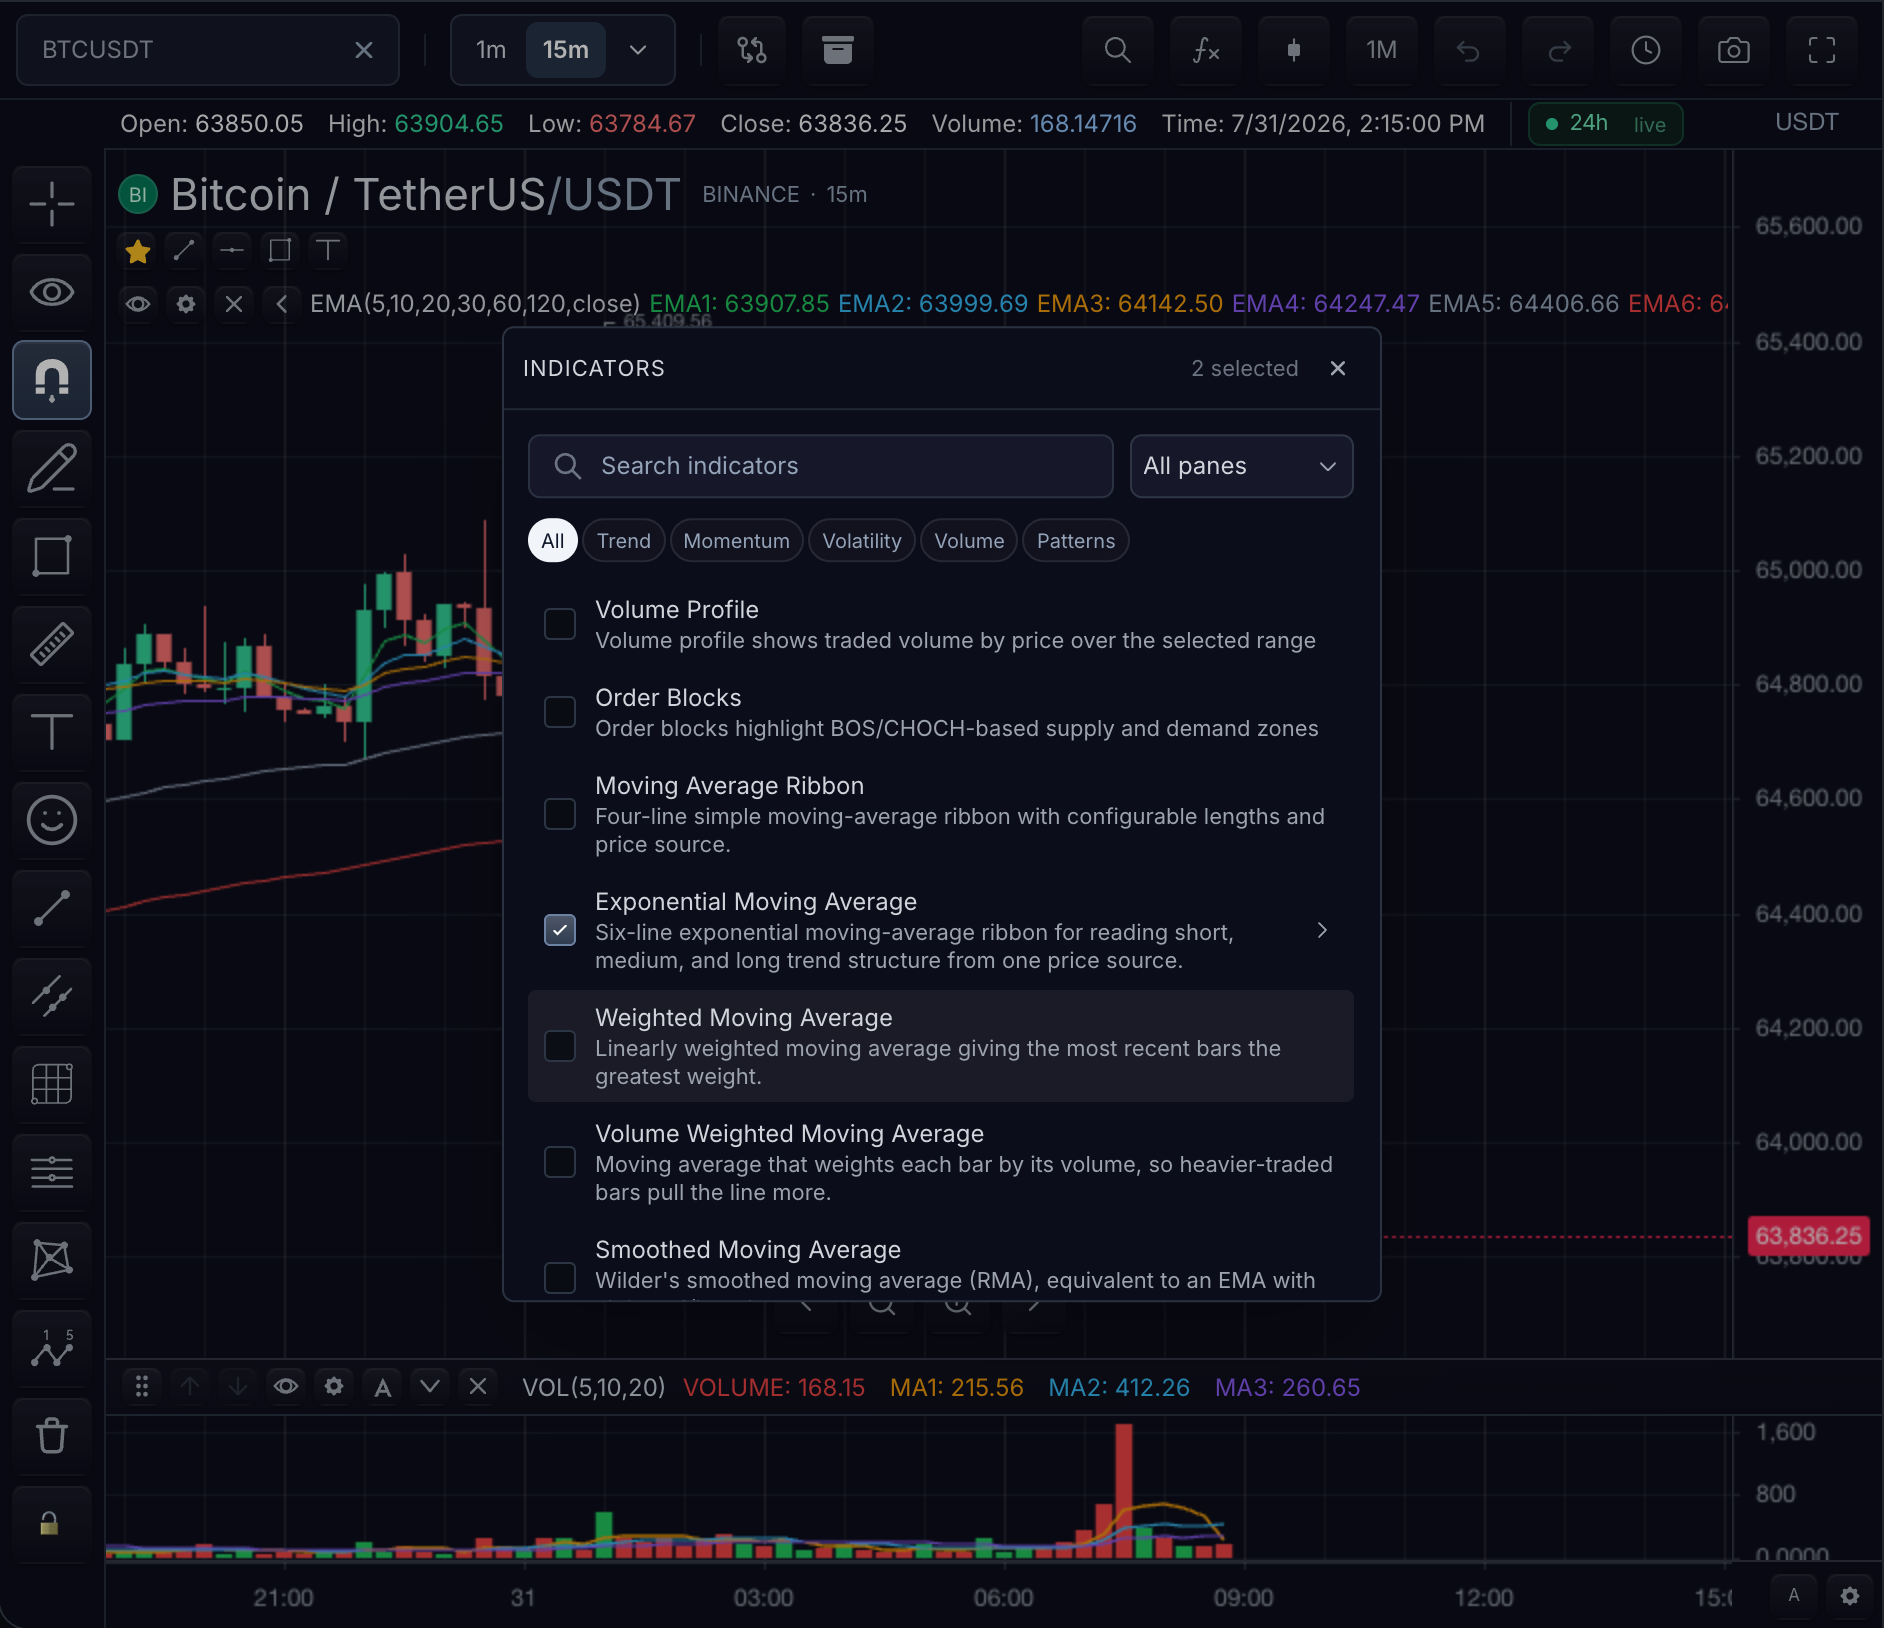
Indicators turn chart data into lines, columns, signals, labels, and overlays. Start with a built-in indicator when it matches your use case. Create a custom indicator when your product needs a calculation or visual that is not in the catalog.
| Path | Choose it when | Integration work |
|---|---|---|
| Built-in indicator | The catalog already provides the calculation | Add it by id and pass any inputs or styles you want to override |
| Custom indicator | You need your own calculation, inputs, or output | Add a TypeScript module to your application, register it during startup, then add it to a chart |
Add a built-in indicator
Add an indicator by its catalog id:
const id = await chart.addBuiltInIndicator('RSI', {
  inputs: { length: 14 },
})
id identifies this chart instance. Keep it if you plan to update, move, duplicate, or remove the indicator later.
chart.updateIndicator(id, {
  inputs: { length: 21 },
  visible: true,
})

chart.removeIndicator(id)
Browse Built-in Indicators by goal and category, then use the Built-in Indicator Reference for exact ids, inputs, and style keys.
Create a custom indicator
Define the calculation as a TypeScript module. Inputs become editable fields, and plots become visible output on the chart.
import { close, indicator, input, plot } from '@tradescript/pro/sdk/indicators'
import * as ta from '@tradescript/pro/sdk/indicators/ta'

export default indicator('Desk EMA', () => {
  const length = input.int('Length', 20, { id: 'length', min: 1 })
  plot.line(ta.ema(close, length), {
    key: 'ema',
    title: 'EMA',
    color: '#22c55e',
  })
}, { id: 'desk-ema', compactLabel: 'EMA', pane: 'price' })
Register the module once when your application starts, then add it to a chart:
import { registerCustomIndicator } from '@tradescript/pro/sdk/indicators'
import deskEma from './indicators/deskEma'

const name = registerCustomIndicator(deskEma)

const id = await chart.addIndicator({
  name,
  paneId: 'candle_pane',
})
See Write a Custom Indicator for the complete integration, including how to verify the resulting Settings fields and chart output.
Configure an indicator
You can set inputs, styles, visibility, pane placement, and price-scale behavior when adding an indicator or later through updateIndicator.
chart.updateIndicator(id, {
  inputs: { length: 50 },
  styles: { ema: { color: '#38bdf8', width: 2 } },
  visible: true,
})
The chart saves these instance settings in getState() / setState(). Indicator Settings explains precedence, persistence, and reset behavior.
What to read next
| Need | Page |
|---|---|
| Choose and add a built-in indicator | Built-in Indicators |
| Look up catalog ids, inputs, and styles | Built-in Indicator Reference |
| Write a custom calculation | Write a Custom Indicator |
| Use inputs, plots, markers, alerts, drawings, or multi-symbol data | Indicator Language |
| Use technical-analysis and math helpers | TypeScript Stdlib |
| Persist and update indicator settings | Indicator Settings |
Next steps
- Custom Indicator Recipes — working patterns for overlays, signals, bands, and comparisons.
- Use secondary market data — provide secondary market data to a custom indicator.