Overlays
Drawing overlays are chart-owned objects with stable JSON definitions. The smallest workflow is create, inspect, update, and remove; persistence is a separate adapter concern.
1. Create the smallest overlay
Tool ids and their documented style paths come from the
Drawing Tool Reference; points use data-space time (or
dataIndex) and value:
const drawingId = await chart.createDrawing({
  type: 'horizontalStraightLine',
  points: [{ time: 1_719_878_400_000, value: 64_000 }],
  styles: { line: { color: '#3b82f6', size: 2 } },
});
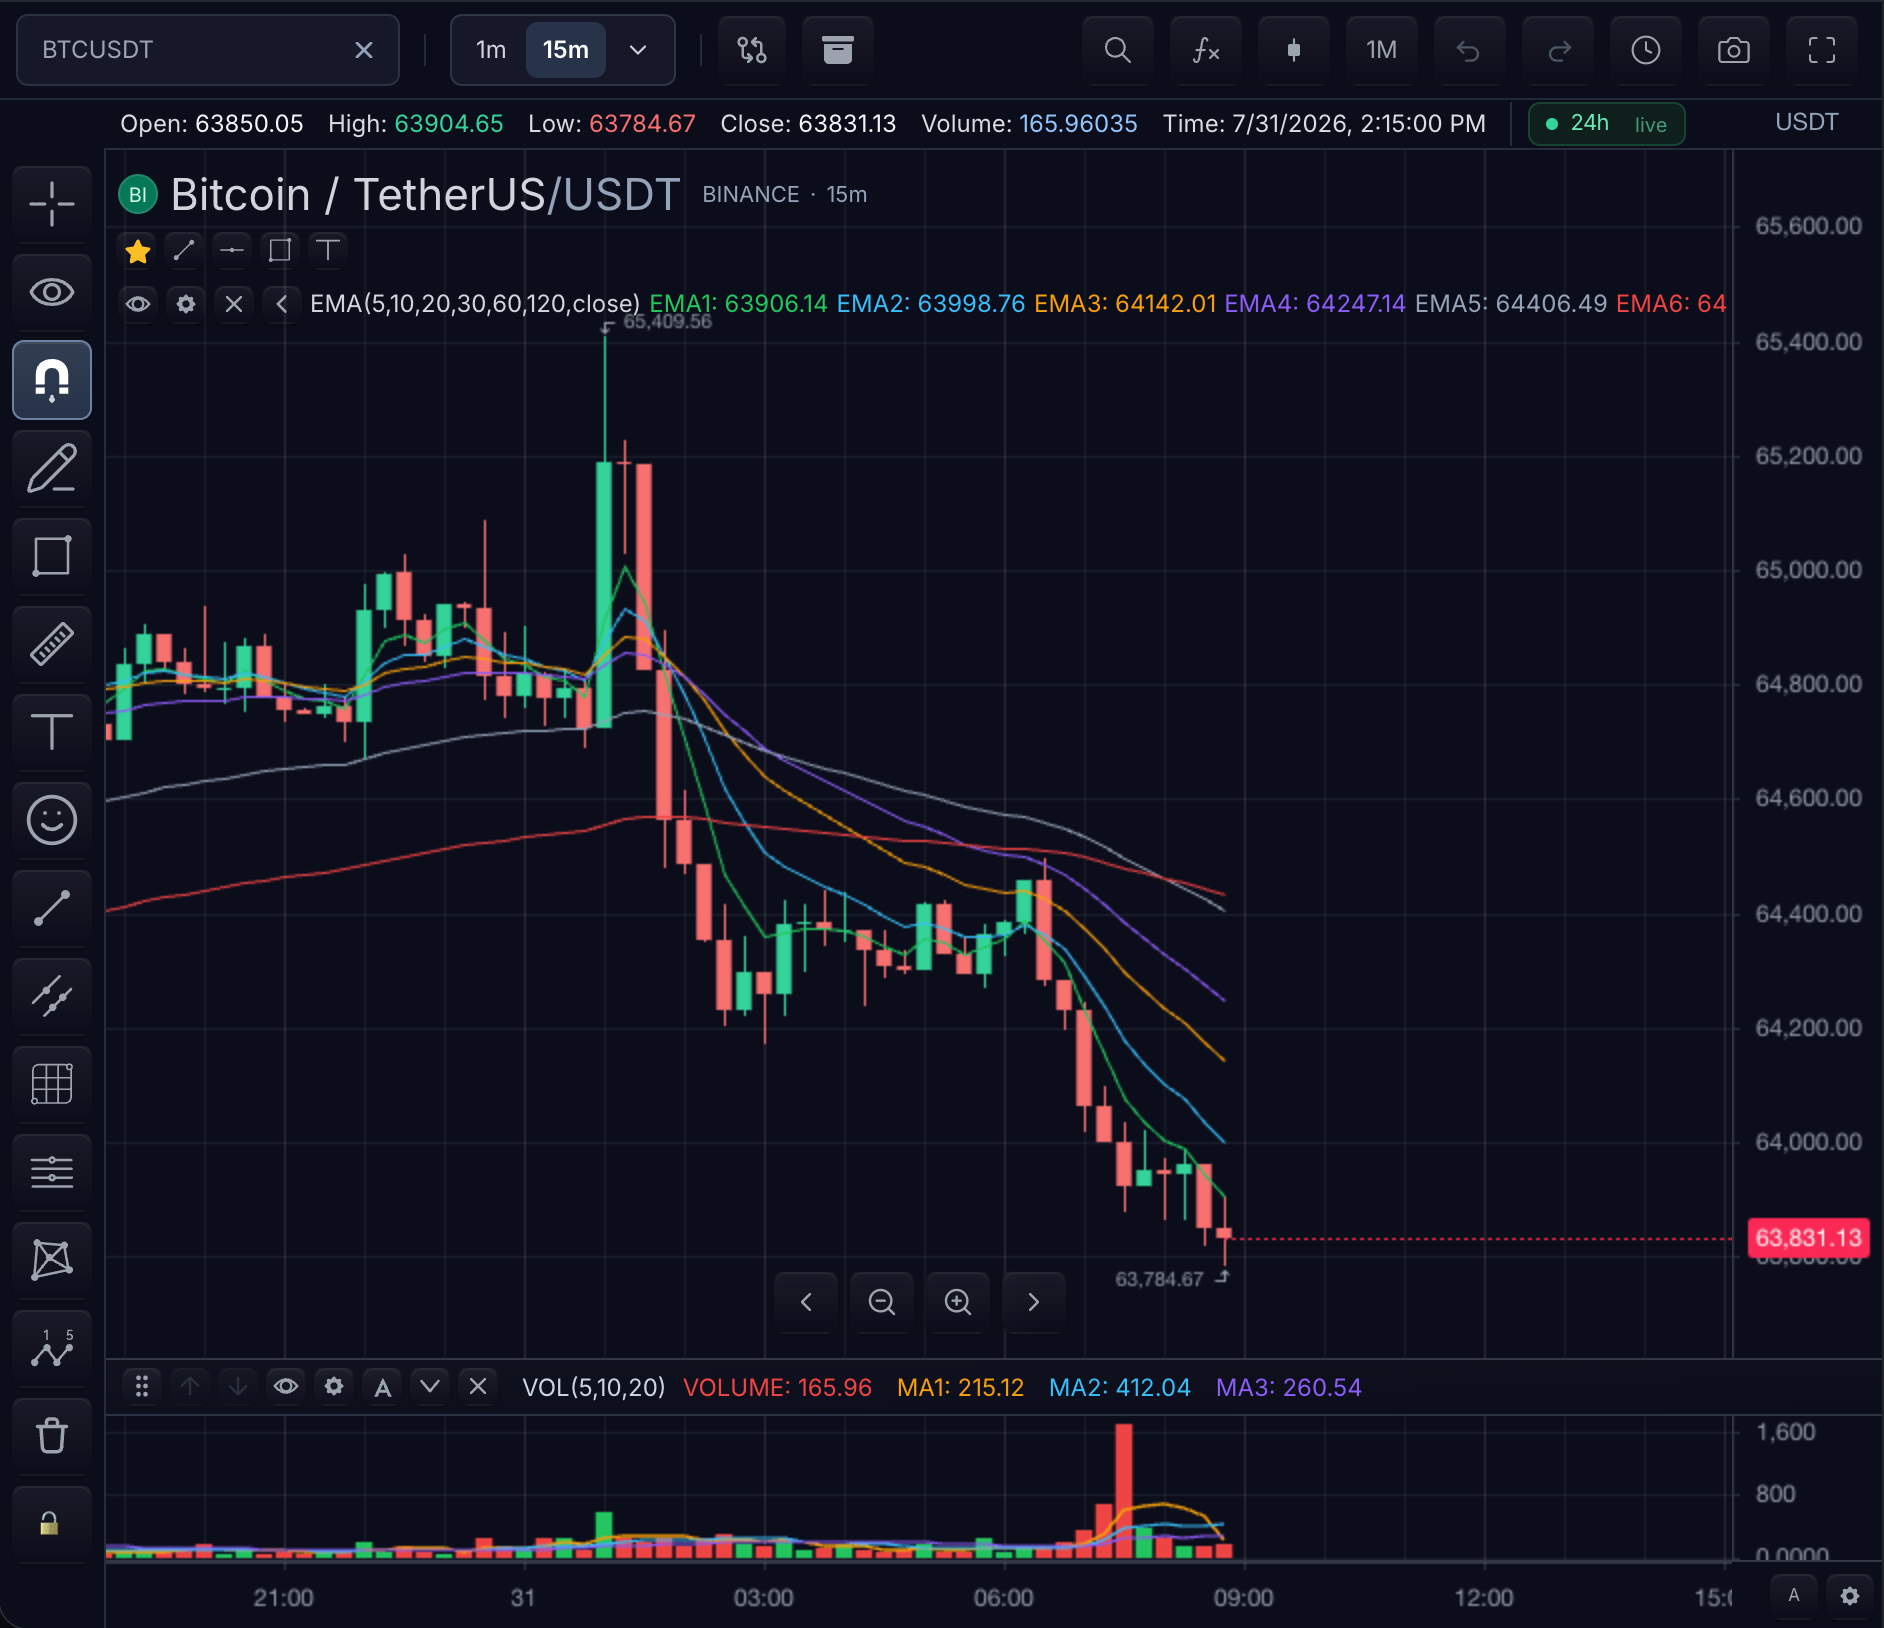
Before: the main price pane shows only chart data. After: a blue horizontal
line spans the pane at value 64,000, and chart.listDrawings() contains
drawingId.
Checkpoint: chart.listDrawings() contains drawingId, and the line is
visible on the main price pane.
2. Update geometry
Geometry changes go through the same patch channel as any other update; only send the fields that changed:
await chart.updateDrawing(drawingId, {
  points: [{ time: 1_719_878_400_000, value: 66_500 }],
});
Before: the line sits at 64,000. After: the same drawing — same id, same styles — sits at 66,500. Keeping the id stable is what lets selection, grouping, undo history, and storage reconcile the object.
3. Style
Style patches deep-merge into the drawing's existing styles; use only the
style paths the reference documents for the tool:
await chart.updateDrawing(drawingId, {
  styles: { line: { color: '#f59e0b', size: 3 } },
  locked: true,
});
Before: a thin blue line the user can drag. After: a thicker amber line that
ignores pointer edits (locked: true) — still the same id and geometry. To
restyle future drawings of a tool instead of one existing drawing, use
customization().setDrawingDefaultStyles(toolId, styles) (see
styling defaults).
4. Remove and verify cleanup
await chart.removeDrawing(drawingId);
Before: the amber line renders and is listed. After: the drawing is absent
from both the canvas and chart.listDrawings(); a later updateDrawing
against the removed id fails rather than resurrecting it.
Checkpoint: the drawing is absent from both the canvas and
chart.listDrawings().
Complete drawing definition
export interface DrawingDefinition {
  id?: string;
  type: string;
  paneId?: string;
  points?: DrawingPoint[];
  styles?: Record<string, unknown>;
  locked?: boolean;
  visible?: boolean;
  zIndex?: number;
  groupId?: string;
  scope?: DrawingScope;
  intervals?: ChartInterval[];
  metadata?: Record<string, unknown>;
}
DrawingSnapshot is an array of DrawingDefinition values.
Storage payload
Persist drawings through DrawingState:
export interface DrawingState {
  chartId?: string;
  symbol?: string;
  interval?: ChartInterval;
  drawings: DrawingSnapshot;
  metadata?: Record<string, unknown>;
}
The payload preserves geometry, style, visibility, grouping, locking, z-order, scope, and interval metadata.
Next steps
- Drawing Persistence — save and restore ownership between chart, adapter, and host storage.
- Drawing Tools — the three paths a drawing can come to exist through.
- Drawing Tool Reference — the style paths available on each tool you create.